
Study on Analytical Method for Pore Size Distribution of the Lower Cambrian Niutitang Formation Shale in Southeastern Chongqing
-
摘要: 低温氮气吸附法已普遍用于评价页岩的孔隙结构,但是文献中报道的脱气温度和脱气时间等测试条件不尽相同,此外测试结果中经常出现滞后环不闭合的情况,严重影响了孔径分布等结构参数测试的准确性。为了评价和探索有效的页岩孔径分布测试方法,本文选取渝科1井下寒武统牛蹄塘组黑色页岩,重点研究应用低温氮气吸附法分析其孔径分布的测试条件,系统探讨了样品质量、脱气温度、升温速率和脱气时间对测试结果的影响,通过进一步优化参数建立了可靠的孔径分布测试方法,并成功用于测定其他页岩样品。结果表明:吸附-脱附等温线呈反C型,属于Brunauer等提出的BDDT等温吸附曲线分类中的V型,滞后环完全闭合,属于IUPAC分类中的H4型,对应狭窄的狭缝型孔隙,说明此类页岩中除了含有峰值孔径主要集中在3.5~4.5 nm的中孔和一定数量的大孔外,还存在大量微孔。研究认为脱气温度是影响测试结果的主要因素。该研究是页岩孔径分布测试方法的一项补充,为我国页岩气的深入研究提供了关键参数支持。要点
(1) 对下寒武统牛蹄塘组页岩的氮气吸附实验测试条件进行选取和优化。
(2) 脱气温度是影响孔隙结构参数测试结果的主要因素。
(3) 优化后的测试参数可使滞后环闭合。
(4) 建立了可靠的孔径分布测试方法。
HIGHLIGHTS(1) The experimental conditions for the study of nitrogen adsorption of the lower Cambrian Niutitang Formation shale were selected and optimized.
(2) Degassing temperature was the main factor affecting the pore structural parameter.
(3) The optimized test parameters can close the hysteresis loop.
(4) A reliable method for measuring pore size distribution was established.
Abstract:BACKGROUND The low-temperature nitrogen (N2) adsorption-desorption method has been widely used to evaluate the pore structure of shale, however, the different analytical conditions such as degassing temperature and degassing time were reported in the literature. In addition, closure of the hysteresis loop often occurs in the test results, which seriously affects the accuracy of the structural parameters such as pore size distribution.BAOBJECTIVES To evaluate and explore an effective method for measuring pore size distribution in shale, using the black shales from the Department of Chongqing 1 well Lower Cambrian Niutitang Formation.METHODS Measurement conditions using low-temperature N2 adsorption method to analyze the shale pore size distribution. The effects of sample weight, degassing temperature, heating rate, and degassing time on the analytical results were systematically discussed. A reliable measurement method of pore size distribution is established by further optimizing the parameters, which has been successfully used in the determination of other shale samples.RESULTS The results show that the isothermal adsorption-desorption curves of the samples are inverse C type, which belong to the V type of BDDT isotherm adsorption curve proposed by Brunauer et al. The hysteresis loops belong to the H4 type in the IUPAC classification, which corresponds to the narrow slit-like pores, indicating that there are a large number of micropores in the shale, in addition to the mesopores with a peak pore size concentrating at 3.5-4.5 nm and a certain number of macropores.CONCLUSIONS Degassing temperature is the main factor affecting the analytical results. This study complements the exploration on the testing method of pore size distribution in shale and provides the key parameters for further study of shale gas in China.
-
土地复垦是指对在生产建设过程中,因挖损、塌陷、压占等造成破坏的土地,采取整治措施,使其恢复到可供利用状态的活动[1],主要涉及矿产资源开采、化工产业、燃煤发电等[2-3]。复垦土地样品的特点是样品基质复杂,干扰因素较多,前处理困难,污染物种类多,迁移规律复杂,各类指标检出率高[4-5]。随着“绿水青山”的理念深入人心,全社会对环保的重视程度越来越高,复垦土地的质量评价中对各类污染物检出限的要求也更加严格[6-7]。目前各类污染物指标中,酚类污染物的色谱直接检测方法,存在色谱响应值低、易挥发、稳定性与回收率差等问题[8]。低浓度样品测定难度较大,有待研究改进。
酚类化合物是一类中等强度的化学毒物,与细胞原浆中的蛋白质发生化学反应[9],可经皮肤粘膜、呼吸道及消化道进入体内[10-11]。低浓度可引起蓄积性慢性中毒,高浓度可引起急性中毒以致昏迷死亡[12-13]。环境中的酚污染主要是指酚类化合物对水体土壤的污染,含酚废水是当今世界危害大、污染范围广的工业废水之一[14]。在许多工业领域诸如采矿、焦化、炼油、冶金、石油化工、化学合成业、医药、农药、油漆等工业排出的废水中均含有酚类化合物[15]。
根据酚类化合物的性质,可采用气相色谱、液相色谱、气相色谱-质谱联用法[16-18]以及4-氨基安替比林分光光度法[19](HJ/T 32—1999)对其进行测定。其中,气相色谱法[20-21]的方法检出限为10~60μg/kg,液相色谱法[22-23]的方法检出限为10~50μg/kg,气相色谱-质谱法[24-26]的方法检出限为9.60~480μg/kg。可见,直接测定的检出限较高且范围较宽,难以满足痕量检测的需要。酚类化合物在气相色谱检测器或质谱上的响应值比较低,为实现更低的检出限,可采用衍生化的方法进行测定[27]。常见的衍生化方法有:酰化衍生,多采用七氟丁酸酐或者乙酸酐作为衍生试剂[28-29];烷基化衍生,试剂主要为重氮甲烷、五氟苄基溴(PFB)[30-31];硅烷基化衍生,常用的试剂为三甲基硅烷(TMS)[32-33];溴化反应,采用酸性条件下KBr-KBrO3溶液为衍生化试剂[34]。各衍生化试剂都可以提高酚类的色谱相应值,同样也各有缺点,如三甲基衍生物不稳定、易分解;酰化、溴化反应衍生物对色谱柱有伤害;五氟苄基溴对人有刺激性等。本文针对复垦土地样品基质复杂、干扰因素多、前处理困难等特点,对该类样品的提取与净化方法进行筛选优化。根据酚类污染物检测中检出限高、范围大、重现性差等问题,通过衍生化与非衍生化效果的对比、衍生化条件优化、实际样品测定等方面,建立了复垦土地样品酚类污染物的衍生化气相色谱-质谱检测方法。
1. 实验部分
1.1 仪器和主要试剂
ASE350加速溶剂萃取仪(美国ThermoFisher公司):配24位萃取盘,不锈钢萃取池。
TRACE2000 DSQ气相色谱-质谱仪(美国ThermoFisher公司):配色谱柱(长30m,内径0.25mm,固定相液膜厚度0.25μm,固定相为5%-苯基-甲基聚硅氧烷)。
酚类化合物混合标准溶液: 浓度为1000mg/L(美国O2si smart solutions公司)。替代物标准溶液:两种替代物混合标准溶液,浓度为1000mg/L(美国O2si smart solutions公司)。内标:苊-d10,浓度为1000mg/L(美国O2si smart solutions公司)。
衍生化试剂:五氟苄基溴(C7H2BrF5),规格为5g,98%(Alfa Aesar公司)。ρ=0.05g/mL。称取0.5g五氟苄基溴,溶于丙酮,并定容在10.0mL容量瓶中,4℃下避光冷藏,待用。
碳酸钾溶液(ρ=0.1g/mL): 称取1g碳酸钾(丙酮浸泡清洗并氮气吹干)溶于水中,定容至10.0mL,待用。
无水硫酸钠、粒状硅藻土:置于马弗炉中450℃烘4h,冷却后装入干燥器中保存。
正己烷、丙酮、二氯甲烷等均为色谱纯(美国J.T.Baker公司)。
1.2 实验样品
复垦土地样品:采自陕西某金属矿区的复垦土地。采集地表 50cm以下、粒径小于0.425mm的土壤样品。
1.3 实验方法
1.3.1 样品前处理
索氏提取[35-36]:称取5g土壤样品,加入替代物使用液,所有样品转入纸质套筒,置于索氏提取器回流管中,在圆底溶剂瓶中加入120mL正己烷-丙酮(体积比1:1)混合溶剂,提取16~18h,回流速度控制在每小时4~6次,收集提取液。
超声波提取[37-38]:称取5g土壤样品,加入替代物使用液,添加30mL正己烷-丙酮(1:1)混合溶剂,所有样品加入具塞比色管中,超声提取15min,将提取液倒入氮吹瓶中,再次添加30mL正己烷-丙酮(1:1)混合溶剂,超声提取15min,然后加入20mL正己烷-丙酮(1:1)混合溶剂洗涤一次,合并提取液。
加速溶剂萃取[39-41]:称取5g土壤样品于34mL萃取池中,加入替代物使用液,加入填充剂(粒状硅藻土)与干燥剂(无水硫酸钠)。萃取溶剂为正己烷-丙酮(1:1)混合溶液,温度100℃,压力1500psi,静态萃取时间5min,溶剂淋洗体积为60%池体积,循环2次,吹扫时间60s,收集提取液。
旋转蒸发浓缩:将萃取液转入合适体积的圆底烧瓶,浓缩至2mL左右,转出提取液,用正己烷清洗3次圆底烧瓶,溶液转移至浓缩管合并。再用小流量氮气浓缩至3~5mL,待衍生化。
氮吹浓缩:萃取液转入浓缩管中,开启氮吹浓缩。氮吹过程中应将已经露出的浓缩器管壁用正己烷反复多次洗涤。浓缩至3~5mL,待衍生化。
衍生化:在浓缩液中加入100μL五氟苄基溴溶液(ρ=0.05g/mL)和100μL碳酸钾溶液(ρ=0.1g/mL),混匀。加入丙酮使之达到8mL左右,置于60℃水浴中,保持60min,冷却至室温。继续氮吹浓缩,加入内标液,定容至1.0mL,待测。
净化:如萃取液浑浊或颜色很深,则需要净化,可采用小柱净化法[42-43]。具体如下:先用12mL 10%正己烷-二氯甲烷淋洗硅酸镁小柱(1g/6mL),再用12mL正己烷淋洗,在液面消失前,将萃取液的浓缩液转移至净化柱中,用少量正己烷洗涤浓缩瓶,洗涤液一并转移至净化柱上(注意应始终保持填料上方留有液面),再用12mL 10%正己烷-二氯甲烷洗脱样品,收集于试管中。
1.3.2 气相色谱-质谱分析条件
毛细管色谱柱HP-5MS,30m×0.25mm×0.25μm。气相色谱条件:进样口温度260℃;载气为氦气,流速1.0mL/min;不分流进样,进样量1.0μL。升温程序:初始温度55℃,保持1min,以6℃/min升温至230℃,保持5min。
质谱条件:接口温度250℃;离子源温度250℃;电离方式为电子轰击电离(EI);电离能量70eV;溶剂延迟15min;选择离子(SIM)模式。各化合物的出峰顺序与特征离子见表 1与图 1(其中2,4,6-三氯苯酚和2,4,5-三氯苯酚,以及2, 3, 4, 5-四氯酚和2, 3, 5, 6-四氯酚,因无法分离而合并计算),标准曲线见表 2。
表 1 各组分保留时间、定量离子与辅助离子Table 1. Retention time, quantitative ions and auxiliary ions of each component序号 化合物 保留时间(min) 定量离子/辅助离子 1 2-氟苯酚-PFB(替代物) 16.19 181/292 2 苯酚-PFB 16.61 181/274 3 苊-d10(内标) 16.83 162/164 4 间-甲酚-PFB 17.89 181/288 5 邻-甲酚-PFB 18.35 181/288 6 对-甲酚-PFB 18.50 181/288 7 2-氯苯酚-PFB 19.65 308 8 2, 4-二甲酚-PFB 19.65 121 9 2, 6-二氯酚-PFB 21.57 181/342 10 4-氯-3-甲基苯酚-PFB 21.98 181/322 11 2, 4-二氯酚-PFB 22.62 181/342 12 2-硝基酚-PFB 23.64 181/319 13 2, 4, 6-三氯苯酚-PFB/2, 4, 5-三氯苯酚-PFB 23.79 181/376 14 2, 4-二硝基酚-PFB 25.19 181/161 15 4-硝基酚-PFB 25.61 181/319 16 2, 3, 4, 6-四氯酚-PFB 26.76 181/412 17 2, 3, 4, 5-四氯酚-PFB/2, 3, 5, 6-四氯酚-PFB 26.91 181/412 18 2, 3, 5, 6-四氯酚-PFB 28.34 181/161 19 2, 4, 6-三溴苯酚-PFB(替代物) 28.47 181/431 20 五氯苯酚-PFB 29.70 181/446 ![]() 图 1 酚类化合物衍生物总离子流图出峰顺序:1—2-氟苯酚(替1);2—苯酚;3—苊-d10(16.83);4—间-甲酚;5—邻-甲酚;6—对-甲酚;7—2-氯苯酚;2, 4-二甲酚;8—2, 6-二氯酚;9—4-氯-3-甲基苯酚;10—2, 4-二氯酚;11—2-硝基酚;12—2, 4, 6-三氯苯酚和2, 4, 5-三氯苯酚;13—2, 4-二硝基酚;14—4-硝基酚;15—2, 3, 4, 6-四氯酚和2, 3, 4, 5-四氯酚;16—2, 3, 5, 6-四氯酚;17—2-甲基-4, 6-二硝基酚;18—2, 4, 6-三溴苯酚(替2);19—五氯苯酚。Figure 1. Total particle flow diagram of phenolic compounds derivatives表 2 酚类化合物标准曲线Table 2. Calibration curves of phenolic compounds
图 1 酚类化合物衍生物总离子流图出峰顺序:1—2-氟苯酚(替1);2—苯酚;3—苊-d10(16.83);4—间-甲酚;5—邻-甲酚;6—对-甲酚;7—2-氯苯酚;2, 4-二甲酚;8—2, 6-二氯酚;9—4-氯-3-甲基苯酚;10—2, 4-二氯酚;11—2-硝基酚;12—2, 4, 6-三氯苯酚和2, 4, 5-三氯苯酚;13—2, 4-二硝基酚;14—4-硝基酚;15—2, 3, 4, 6-四氯酚和2, 3, 4, 5-四氯酚;16—2, 3, 5, 6-四氯酚;17—2-甲基-4, 6-二硝基酚;18—2, 4, 6-三溴苯酚(替2);19—五氯苯酚。Figure 1. Total particle flow diagram of phenolic compounds derivatives表 2 酚类化合物标准曲线Table 2. Calibration curves of phenolic compounds化合物 衍生后化合物 标准曲线 相关系数(r2) 2-氟苯酚(替1) 2-氟苯酚-PFB y=-0.0144696+0.00229139x 0.9972 苯酚 苯酚-PFB y=-0.0378798+0.00276533x 0.9981 间-甲酚 间-甲酚-PFB y=-0.0360363+0.00218262x 0.9989 邻-甲酚 邻-甲酚-PFB y=-0.0670299+0.00232614x 0.9977 对-甲酚 对-甲酚-PFB y=-0.0572942+0.0022358x 0.9974 2-氯苯酚 2-氯苯酚-PFB y=-0.102385+0.00450636x 0.9954 2, 4-二甲酚 2, 4-二甲酚-PFB y=-0.105425+0.00450302x 0.9962 2, 6-二氯酚 2, 6-二氯酚-PFB y=-0.0143943+0.00231734x 0.9977 4-氯-3-甲基苯酚 4-氯-3-甲基苯酚-PFB y=-0.10396+0.00239979x 0.9969 2, 4-二氯酚 2, 4-二氯酚-PFB y=-0.138599+0.00289315x 0.9970 2-硝基酚 2-硝基酚-PFB y=-0.0677484+0.00135676x 0.9961 2, 4, 6-三氯苯酚/2, 4, 5-三氯苯酚 2, 4, 6-三氯苯酚-PFB/2, 4, 5-三氯苯酚-PFB y=-0.147103+0.0029088x 0.9966 2, 4-二硝基酚 2, 4-二硝基酚-PFB y=-0.0550873+0.00259657x 0.9984 4-硝基酚 4-硝基酚-PFB y=-0.0800387+0.00145206x 0.9956 2, 3, 4, 6-四氯酚 2, 3, 4, 6-四氯酚-PFB y=-0.141921+0.00277173x 0.9957 2, 3, 4, 5-四氯酚/2, 3, 5, 6-四氯酚 2, 3, 4, 5-四氯酚-PFB/2, 3, 5, 6-四氯酚-PFB y=-0.127976+0.00369817x 0.9954 2-甲基-4, 6-二硝基酚 2-甲基-4, 6-二硝基酚-PFB y=-0.160452+0.00301742x 0.9945 2, 4, 6-三溴苯酚(替2) 2, 4, 6-三溴苯酚-PFB y=-0.144911+0.00221011x 0.9982 五氯苯酚 五氯苯酚-PFB y=-0.145926+0.00302867x 0.9981 1.3.3 质量控制
所使用的有机试剂均应浓缩后进行空白检查(浓缩倍数视分析过程中最大浓缩倍数而定),试剂空白测试结果中目标物浓度应低于方法检出限。用处理过的硅藻土代替样品,与实际样品同步分析。测定结果中目标物浓度应不超过方法检出限。①基体加标样品。加标回收率范围应在70%~130%之间。每个样品在称取之后、处理之前都应加入一定量的替代物,应确定替代物回收率在70%~130%之间。②重复样检查。两个重复样品结果偏差应≤20%,低于方法检出限的不计。
2. 结果与讨论
2.1 前处理方法筛选
通过对三种前处理方法的方法检出限、测定下限、加标回收率、精密度,以及各方法在实际操作中的特点进行全面比较,筛选出更合适的前处理方法。
分别采用索氏提取、超声波提取、加速溶剂萃取(ASE)处理加标后的空白样品(加标浓度为10μg/kg),分别将三种方法所得提取液浓缩,经硅酸镁小柱净化,然后进行衍生化处理,最后浓缩并加入内标物定容至1mL。测定并计算酚类化合物的方法检出限与测定下限(表 3)。其中ASE方法的检出限最低,检出限范围最小。原因可能是ASE的提取过程都是在密闭条件下进行,没有外界干扰, 且整个过程由仪器自动完成,样品处理之间差异相对最小。
表 3 三种提取方法的检出限、测定下限与精密度与回收率情况Table 3. Detection limit, determination lower limit, precision and recovery of the three extraction methods提取方式 方法检出限(μg/kg) 测定下限(μg/kg) 加标回收率(%) 回收率平均值(%) 相对标准偏差平均值(%) 索氏提取 0.97~4.36 3.88~17.4 73.3~102.0 88.9 4.9 超声波提取 0.78~5.06 3.11~20.2 71.4~97.3 82.4 5.4 加速溶剂萃取 0.67~3.95 2.68~15.8 75.4~107.0 91.0 4.4 在空白土壤样品中加入一定量的酚类化合物标准品与替代物。使其理论浓度为40μg/kg。称取5g样品,分别采用索氏提取、超声波提取、加速溶剂萃取对样品进行前处理,每种方法重复6次,比较加标回收率与结果精密度(表 3)。三种处理方法均能满足试验要求,综合比较三种方法的精密度与回收率,ASE处理的效果最好,RSD最小,重现性最好,回收率最高。索氏提取次之,超声提取最差。又因为索氏提取耗时最长,消耗溶剂最多,因此选择ASE为最佳前处理方法。
2.2 衍生化与非衍生化对比
气相色谱或气相色谱-质谱联用分析酚类化合物,在不衍生情况下,表现在色谱图上的响应值比较低,各组分峰面积(峰高)差距很大。配制标准曲线的最低浓度一般为1~5mg/L,导致各组分的检出限不够低,差距也很大,导致检出限范围非常宽泛,甚至相差一个数量级以上。而衍生后信号强度较高,峰高更均衡(图 1),检出限范围更为合理。
根据文献与相关标准方法记载,非衍生化检测酚类化合物的检出限一般在10~80μg/kg的范围之内。例如,《全国土壤污染状况详查土壤样品分析测试方法技术规定》发布稿中提到的酚类化合物检出限为20~80μg/kg。杨丽莉等[20]采用超声波提取气相色谱法测定土壤中21种酚类化合物,检出限为10~60μg/kg。本文按照上述方法,采用ASE处理加标后的空白样品(加标浓度分别为200μg/kg、10μg/kg)。重复7次,测定并计算方法检出限,得到非衍生酚类化合物检出限为12.5~51.0μg/kg,衍生化检出限为0.67~3.95μg/kg。衍生化之后,虽然增加了分析步骤,但方法检出限以及精密度明显优于非衍生方法。
2.3 衍生化方法优化
2.3.1 衍生化试剂的选择
酚类化合物的衍生化思路有烷基化、酰基化、硅烷基化等[27]。常用的衍生化试剂有五氟苄基溴、三甲基硅烷、四氯邻甲氧基苯酚等。各类衍生化试剂各有优劣,但都能满足测试要求。已有研究[28-34]表明,三甲基硅烷衍生物具有热稳定好、挥发性强、易于制备及色谱性能好等优点。但三甲基衍生物对水和酸不稳定,易分解,容易被提取液中水分影响。酰化反应的效果也很好,但使用的试剂对仪器及色谱柱的伤害较大。烷基化衍生检测法比较成熟,常用衍生试剂为五氟苄基溴,其缺点是衍生物在质谱中基峰单一,不利于定性。另外,五氟苄基溴为有毒化学试剂,对检测人员的眼睛具有较强的刺激性。其中,五氟苄基溴衍生物的缺点较容易解决,操作时可保持佩戴手套、护目镜并在通风柜中进行。综合分析,三种方法各有优劣,考虑到测定准确性与色谱柱寿命等方面,本方法选用五氟苄基溴作为衍生化试剂。
2.3.2 衍生化温度的优化(两种替代物)
分别在35℃、40℃、45℃、50℃、55℃、60℃温度下进行衍生化反应,时间控制在1h。利用两种替代物回收率计算衍生化反应效率(图 2)。结果表明,替代物回收率随温度升高而增加,温度超过55℃,处理后的液体中已基本没有残余的酚类物质。并且,替代物加标回收率(91%和93%)也满足检测要求,而温度超过60℃萃取液极易沸腾,导致溶剂损失过快。又因为在水浴锅中反应,温度控制较为困难,因此温度设定在55~60℃之间即可,无需过于精确。
![]() 图 2 不同温度下衍生化的替代物回收率变化Figure 2. Changes in the recovery of substitutes derived at different temperature
图 2 不同温度下衍生化的替代物回收率变化Figure 2. Changes in the recovery of substitutes derived at different temperature2.3.3 衍生化时间的确定
准备7个加标样品进行前处理,并按上述方法进行衍生化反应。从第10min开始浓缩处理,并计算替代物回收率(图 3)。结果显示,替代物回收率随时间增加而增加,反应时间超过50min后,两种替代物回收率分别为89%与87%,已经可以满足检测要求,而时间达到60min衍生反应基本完成,处理液中几乎没有残余的酚类物质。因此,衍生化时间确定为60min。
![]() 图 3 衍生化时间对替代物回收率的影响Figure 3. Effect of derivation time on the recovery of substitutes
图 3 衍生化时间对替代物回收率的影响Figure 3. Effect of derivation time on the recovery of substitutes2.3.4 衍生化试剂的用量
关于五氟苄基溴与碳酸钾的加入量,主要考虑的是确保曲线最高浓度也能快速、完全反应,以及可适用于高浓度实际样品。而碳酸钾的作用是消耗反应生成物,加速衍生化反应进行,因此需要两种衍生化试剂远远过量即可。通过试验,确定过量10倍左右较为合适。通过计算,将衍生物加入量定为各100μL(五氟苄基溴浓度50mg/mL,碳酸钾浓度100mg/mL)。
2.4 方法检出限、基质加标回收率与精密度
采用ASE处理加标后的空白样品(加标浓度为10μg/kg),重复7次测定并计算酚类化合物的方法检出限,得到的方法检出限为0.67~3.95μg/kg,测定下限为2.68~15.8μg/kg(表 4)。五氟苄基溴衍生化产物,相较原酚类化合物增加了大分子量基团,提升了衍生物的稳定性,也提高了质谱响应值,与“全国土壤污染状况详查土壤样品分析测试方法”、杨丽莉等[20]、Helaleh等[44]研究结果(10~80μg/kg)相比显著降低了检出限。
表 4 酚类化合物衍生化方法检出限Table 4. Detection limits of phenolic compounds by derivativation method化合物 测定值(μg/kg) 相对标准偏差(%) 检出限(μg/kg) 测定下限(μg/kg) 1 2 3 4 5 6 7 2-氟苯酚(替1) 7.05 7.44 9.32 9.40 8.39 9.33 7.68 1.0 3.13 12.5 苯酚 8.02 7.76 9.27 9.44 9.05 9.89 8.40 0.8 2.47 9.88 间-甲酚 8.38 8.41 7.45 8.14 7.88 7.91 8.27 0.3 1.08 4.32 邻-甲酚 9.44 7.74 9.32 8.98 9.66 8.40 9.01 0.7 2.09 8.35 对-甲酚 8.17 8.37 9.04 8.55 9.15 8.80 9.39 0.4 1.39 5.56 2-氯苯酚 8.75 8.47 8.80 8.82 8.87 8.99 9.16 0.2 0.67 2.68 2, 4-二甲酚 8.72 8.64 8.35 8.11 8.40 8.19 7.85 0.3 0.96 3.83 2, 6-二氯酚 8.63 8.86 7.93 8.08 8.43 7.85 8.70 0.4 1.25 5.02 4-氯-3-甲基苯酚 9.43 10.3 8.86 10.5 9.21 9.63 9.96 0.6 1.85 7.42 2, 4-二氯酚 8.62 9.13 9.73 9.98 8.83 8.51 8.74 0.6 1.80 7.19 2-硝基酚 9.89 9.80 9.03 9.28 8.87 10.0 9.96 0.5 1.50 5.99 2, 4, 6-三氯苯酚/2, 4, 5-三氯苯酚 16.1 16.3 16.0 16.3 16.1 15.4 15.1 0.5 1.46 5.85 2, 4-二硝基酚 11.0 10.6 10.3 10.5 11.2 9.97 11.1 0.5 1.47 5.89 4-硝基酚 10.3 10.3 7.72 10.6 8.11 9.11 10.9 1.3 3.95 15.8 2, 3, 4, 6-四氯酚 8.58 9.24 8.51 8.12 8.71 8.31 9.26 0.4 1.37 5.47 2, 3, 4, 5-四氯酚/2, 3, 5, 6-四氯酚 16.9 16.0 16.3 16.6 18.1 16.5 16.5 0.7 2.12 8.49 2-甲基-4, 6-二硝基酚 8.93 8.25 7.73 7.65 8.04 8.78 9.02 0.6 1.78 7.13 2, 4, 6-三溴苯酚(替2) 7.99 8.08 8.64 7.33 7.21 7.87 7.77 0.5 1.50 6.01 五氯苯酚 10.5 10.9 10.3 9.65 11.1 10.8 10.9 0.5 1.54 6.16 对复垦土地样品进行基质加标回收率实验,三个加标浓度分别为40μg/kg、100μg/kg、200μg/kg。每个浓度样品重复6次,分析结果见表 5。可以看出,高浓度回收率范围为73.6%~103.0%,相对标准偏差(RSD)为2.1%~9.6%;中间浓度回收率范围为73.3%~88.5%,RSD为1.7%~9.5%;低浓度回收率范围为75.4%~107.0%,RSD为3.7%~6.6%。实验结果表明,ASE提取方法对高、中、低三种浓度的基质加标样品的回收率都在70.0%~130.0%之间,并且RSD均小于10%,结果满意。
表 5 酚类化合物加标回收率和精密度Table 5. Spiked recovery and precision tests of phenolic compounds酚类化合物 加标浓度40μg/kg 加标浓度100μg/kg 加标浓度200μg/kg RSD(%) 回收率(%) RSD(%) 回收率(%) RSD(%) 回收率(%) 2-氟苯酚(替1) 6.6 89.2 9.5 80.8 5.9 86.3 苯酚 6.1 94.4 3.6 85.3 8.1 75.3 间-甲酚 6.7 86.8 2.1 73.3 8.1 74.2 邻-甲酚 5.9 87.5 3.3 79.5 4.5 87.1 对-甲酚 5.5 104.0 4.8 82.1 9.6 83.6 2-氯苯酚 5.9 103.0 5.3 81.2 6.3 83.4 2, 4-二甲酚 5.9 84.5 2.9 82.6 7.0 79.9 2, 6-二氯酚 6.2 86.1 6.7 80.8 7.2 88.6 4-氯-3-甲基苯酚 5.0 107.0 1.8 85.0 9.1 92.6 2, 4-二氯酚 5.4 90.7 8.6 77.4 3.5 86.2 2-硝基酚 5.5 106.0 4.5 88.5 4.6 83.5 2, 4, 6-三氯苯酚/2, 4, 5-三氯苯酚 3.8 75.4 6.0 74.7 7.0 81.1 2, 4-二硝基酚 6.2 91.2 8.3 76.7 3.9 80.3 4-硝基酚 5.1 101.0 1.7 83.1 5.5 102.0 2, 3, 4, 6-四氯酚 3.7 103.0 5.3 83.2 5.8 82.1 2, 3, 4, 5-四氯酚/2, 3, 5, 6-四氯酚 5.9 78.3 8.2 83.5 8.0 103.0 2-甲基-4, 6-二硝基酚 5.5 82.1 6.4 80.8 2.1 73.6 2, 4, 6-三溴苯酚(替2) 4.6 81.7 6.2 73.3 8.2 82.8 五氯苯酚 4.1 105.0 2.4 82.8 8.7 78.4 2.5 复垦土地实际样品酚类化合物检测情况
按照优化后的方法对采自陕西某金属矿区复垦土地采集的实际样品进行分析。首先将采集的样品阴干、敲碎、过筛,并收集粒径小于0.425mm的部分。称取5g样品,加入两种替代物使其理论浓度为100μg/kg,拌入5g无水硫酸钠,装入萃取池,用粒装硅藻土填充空隙。按照ASE萃取条件进行提取。提取液浓缩后用硅酸镁小柱净化,净化后的溶液再次浓缩至3mL左右,丙酮定容至8mL。按照优化后的方法进行衍生化。然后浓缩至1mL以下加入内标物定容至1mL,用气相色谱-质谱仪测定,结果见表 6。
表 6 金属矿区复垦土地样品酚类化合物检测结果Table 6. Analytical results of phenolic compounds in dreclaimed land samples from metal mining areas酚类化合物 含量(μg/kg) 重复样相对偏差(%) 检出限(μg/kg) 重复样1 重复样2 2-氟苯酚(替1) 109 96.2 6.2 3.13 苯酚 - - - 2.47 间-甲酚 - - - 1.08 邻-甲酚 < LOD < LOD - 2.09 对-甲酚 25.6 31.6 10 1.39 2-氯苯酚 < LOD < LOD - 0.67 2, 4-二甲酚 < LOD < LOD - 0.96 2, 6-二氯酚 - - - 1.25 4-氯-3-甲基苯酚 - - - 1.85 2, 4-二氯酚 2.43 2.32 2.3 1.80 2-硝基酚 122 138 6.2 1.50 2, 4, 6-三氯苯酚/2, 4, 5-三氯苯酚 31.0 27.5 6.0 0.74 2, 4-二硝基酚 7.84 6.87 6.6 1.47 4-硝基酚 - - - 3.95 2, 3, 4, 6-四氯酚 - - - 1.37 2, 3, 4, 5-四氯酚/2, 3, 5, 6-四氯酚 - - - 1.76 2-甲基-4, 6-二硝基酚 - - - 1.78 2, 4, 6-三溴苯酚(替2) 87.6 93.7 3.4 1.50 五氯苯酚 83.1 78.9 2.6 1.54 注:“-”表示未检出;LOD表示检出限。 两种替代物回收率分别是102%、90.6%与87.6%、93.7%,重复样品的相对偏差(2.3%~10%)均小于20%,并且低浓度组分结果稳定,最终测定结果满意,说明该方法适用于复垦土地样品酚类污染物的分析检测。
3. 结论
本文针对目前复垦土地(土壤)样品中酚类污染物检测的问题,采用衍生化-气相色谱质谱法进行测定。比对筛选样品提取方法,优化并确定了衍生化试剂与条件等参数,规定了质量控制方法。该方法较之非衍生化方法检出限更低,衍生物色谱响应值提高,各化合物的峰面积(峰高)更均衡。衍生化反应的选择性与质谱的选择离子模式分析,更能避免杂质与其他组分的干扰。实际样品的分析结果表明,该方法更适用于复垦土地以及各类复杂基质土壤与固体废物样品中的痕量酚类污染物检测。
目前衍生化测试方法的应用已较为成熟,操作容易,便于推广,具有广阔的应用前景。关于如何进一步简化衍生化步骤,提高分析效率,甚至寻找更适合的衍生化试剂等方面,还有待进一步研究
-
![]()
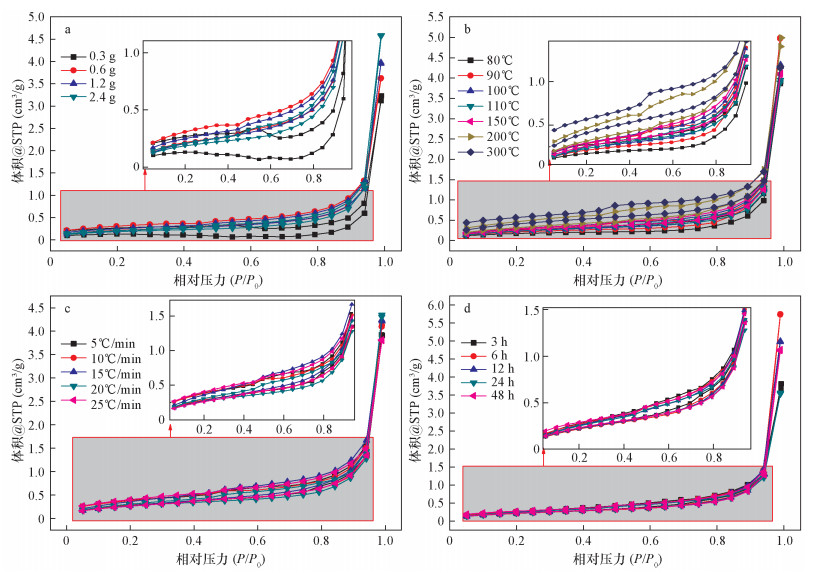
图 1 不同样品质量(a)、不同脱气温度(b)、不同升温速率(c)与不同脱气时间(d)对应的吸附-脱附等温线
Figure 1. Adsorption-desorption isotherms at different sample masse(a), different degassing temperature(b), different heating rate(c), and different degassing time(d)
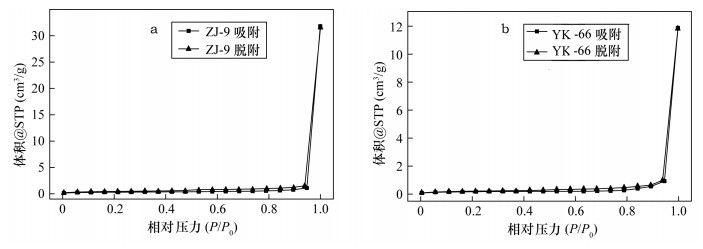
![]()
图 3 页岩样品ZJ-9(a)和YK-66(b)的吸附-脱附等温线
Figure 3. Adsorption-desorption isotherms of shale samples ZJ-9 (a) and YK-66 (b)
![]()
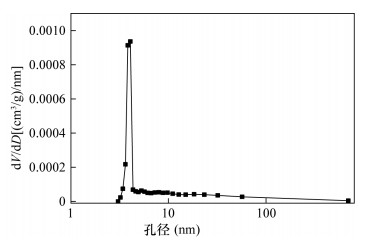
图 4 采用BIH法测定的YK-72孔径分布
Figure 4. Pore size distribution of YK-72 determined by BJH method
表 1 正交试验设计方案
Table 1 Scheme of orthogonal experimental design
实验编号 单因素 样品质量
(g)脱气温度
(℃)升温速率
(℃/min)脱气时间
(h)ZJ-1 0.6 200 5 6 ZJ-2 1.2 250 10 6 ZJ-3 2.4 300 15 6 ZJ-4 2.4 200 10 12 ZJ-5 0.6 250 15 12 ZJ-6 1.2 300 5 12 ZJ-7 1.2 200 15 24 ZJ-8 2.4 250 5 24 ZJ-9 0.6 300 10 24  下载: 导出CSV
表 2 不同单因素条件下页岩样品孔隙结构参数
Table 2 Pore structure parameters of shale samples under different single factor condition
实验编号 比表面积
(m2/g)孔体积
(cm3/g)平均孔径
(nm)ZL-1 0.441 0.01535 139.2 ZL-2 0.477 0.005011 41.98 ZL-3 0.810 0.005624 27.76 ZL-4 0.773 0.006160 31.89 ZL-5 0.696 0.007107 40.83 WD-1 0.641 0.006061 37.84 WD-2 0.789 0.007738 39.24 WD-3 0.881 0.006713 30.48 WD-4 0.890 0.006132 27.55 WD-5 0.973 0.006388 26.26 WD-6 1.212 0.007743 25.55 WD-7 1.549 0.006645 17.16 SR-1 1.078 0.006056 22.46 SR-2 1.092 0.006391 23.42 SR-3 1.089 0.006536 24.00 SR-4 1.014 0.006739 26.98 SR-5 1.013 0.005889 23.25 SJ-1 0.826 0.005910 28.63 SJ-2 0.804 0.008909 44.35 SJ-3 0.825 0.007739 37.53 SJ-4 0.842 0.005521 26.24 SJ-5 0.842 0.007381 35.06
下载: 导出CSV
表 3 正交试验吸附-脱附等温线数据
Table 3 Isotherm data of adsorption-desorption for orthogonal test
ZJ-1 ZJ-2 ZJ-3 ZJ-4 ZJ-5 ZJ-6 ZJ-7 ZJ-8 ZJ-9 相对压力
(P/P0)吸附量
(cm3/g)相对压力
(P/P0)吸附量
(cm3/g)相对压力
(P/P0)吸附量
(cm3/g)相对压力
(P/P0)吸附量
(cm3/g)相对压力
(P/P0)吸附量
(cm3/g)相对压力
(P/P0)吸附量
(cm3/g)相对压力
(P/P0)吸附量
(cm3/g)相对压力
(P/P0)吸附量
(cm3/g)相对压力
(P/P0)吸附量
(cm3/g)0.00510 0.07080 0.00504 0.11036 0.00523 0.12230 0.00505 0.09129 0.00506 0.08887 0.00515 0.12973 0.00509 0.08927 0.00506 0.1206 0.00502 0.14496 0.05758 0.12999 0.05646 0.18864 0.05732 0.20511 0.05779 0.16088 0.05748 0.15892 0.05637 0.21209 0.05666 0.15515 0.05759 0.20208 0.05713 0.23249 0.11025 0.15791 0.10967 0.22721 0.11056 0.24766 0.10893 0.19454 0.11022 0.18545 0.10952 0.25302 0.10985 0.18318 0.10878 0.23964 0.11016 0.26578 0.16246 0.17821 0.16219 0.25615 0.16137 0.27699 0.16145 0.22184 0.16265 0.20067 0.16225 0.28970 0.16233 0.20350 0.16130 0.27017 0.16248 0.29025 0.21487 0.19112 0.21446 0.28426 0.21377 0.30316 0.21404 0.24604 0.21476 0.22399 0.21396 0.31963 0.21467 0.22145 0.21381 0.29762 0.21487 0.30559 0.26704 0.20253 0.26669 0.30809 0.26580 0.33433 0.26632 0.26868 0.26717 0.22863 0.26666 0.35022 0.26688 0.23797 0.26616 0.32207 0.26709 0.32101 0.31936 0.21175 0.31921 0.33158 0.31820 0.36171 0.31834 0.28950 0.31936 0.23898 0.31916 0.37740 0.31919 0.25285 0.31835 0.34644 0.31937 0.33771 0.37179 0.21848 0.37130 0.35161 0.37047 0.38841 0.37096 0.31028 0.37161 0.24803 0.37047 0.40405 0.37143 0.26656 0.37067 0.37029 0.37151 0.36067 0.42367 0.23513 0.42366 0.37252 0.42276 0.41483 0.42296 0.33194 0.42411 0.25888 0.42871 0.52544 0.42359 0.28410 0.42283 0.39462 0.42396 0.36665 0.47597 0.24484 0.47569 0.39389 0.47664 0.44643 0.47551 0.35568 0.47610 0.27376 0.47618 0.55557 0.47588 0.30114 0.47502 0.42031 0.47620 0.37277 0.52867 0.25137 0.52831 0.41456 0.52864 0.48064 0.52743 0.37988 0.52843 0.28091 0.52796 0.58042 0.52817 0.31685 0.52760 0.44660 0.52826 0.39446 0.58063 0.25923 0.58037 0.43802 0.58105 0.51283 0.57984 0.40637 0.58052 0.30372 0.58021 0.61932 0.58197 0.41894 0.58106 0.47866 0.58059 0.40741 0.63285 0.27328 0.63234 0.46486 0.63297 0.55250 0.63404 0.43710 0.63300 0.31616 0.63193 0.65684 0.63308 0.44499 0.63309 0.51908 0.63272 0.43392 0.68530 0.28659 0.68475 0.50467 0.68531 0.59494 0.68566 0.47297 0.68483 0.35214 0.68658 0.70441 0.68535 0.47650 0.68548 0.59319 0.68485 0.46478 0.73697 0.33288 0.73793 0.55359 0.73701 0.64339 0.73865 0.51817 0.73674 0.41964 0.73877 0.76395 0.73796 0.51952 0.73759 0.63521 0.73713 0.49139 0.78951 0.37628 0.79043 0.61599 0.79034 0.71617 0.78938 0.57668 0.78910 0.46815 0.78977 0.84600 0.79037 0.55506 0.78922 0.69493 0.78891 0.55700 0.84333 0.44848 0.84156 0.70295 0.84265 0.81286 0.84235 0.68420 0.84287 0.54837 0.84184 0.94125 0.84247 0.63203 0.84236 0.79320 0.84279 0.63125 0.89445 0.57843 0.89432 0.86052 0.89458 0.97425 0.89353 0.83900 0.89430 0.70355 0.89435 1.11543 0.89546 0.79355 0.89411 0.92811 0.89444 0.76803 0.94704 0.92090 0.94645 1.23936 0.94845 1.37014 0.94619 1.19972 0.94640 1.03886 0.94684 1.47133 0.94617 1.17104 0.94703 1.23435 0.94694 1.11099 0.99842 8.63043 0.99825 10.30235 0.99744 8.13867 0.99796 5.89653 1.00123 4.89185 0.99822 11.89341 0.99949 6.63186 0.99750 12.3956 0.99894 31.79646 0.99835 8.56781 0.99809 10.26169 1.00078 8.13194 0.99730 5.88492 0.99830 4.67749 0.99789 11.89141 0.99706 6.63153 0.99650 12.37882 1.00035 31.70020 0.94384 1.14995 0.94267 1.49753 0.94307 1.64334 0.94490 1.42962 0.94757 1.33499 0.94210 1.76752 0.94065 1.42561 0.94460 1.66995 0.93903 1.52304 0.89436 0.82310 0.89535 1.14954 0.89684 1.30388 0.89513 1.05974 0.89471 0.98192 0.89545 1.41562 0.89364 1.10685 0.89479 1.28345 0.89651 1.24871 0.84229 0.67627 0.84275 0.97152 0.84218 1.11136 0.84316 0.89018 0.84128 0.85479 0.84215 1.23163 0.84131 0.94420 0.84174 1.10554 0.84498 1.08511 0.78993 0.58929 0.78991 0.8691 0.79086 1.00354 0.79024 0.78977 0.78908 0.78255 0.78926 1.13412 0.78899 0.85041 0.79059 0.99789 0.79186 0.98633 0.73701 0.53773 0.73727 0.80090 0.73775 0.92363 0.73683 0.71826 0.73651 0.71927 0.73735 1.05576 0.73626 0.79755 0.73761 0.91386 0.73743 0.91739 0.68421 0.54986 0.68496 0.75000 0.68498 0.86383 0.68644 0.66705 0.68503 0.67198 0.68494 0.99399 0.68421 0.75046 0.68478 0.85098 0.68351 0.86679 0.63208 0.53129 0.63239 0.70638 0.63226 0.82331 0.63335 0.62278 0.63480 0.64889 0.63184 0.93688 0.63357 0.70520 0.63306 0.79747 0.63310 0.82854 0.58171 0.50953 0.58031 0.67161 0.58023 0.78111 0.58100 0.58419 0.57982 0.63831 0.57964 0.88493 0.57928 0.67141 0.58004 0.75392 0.58121 0.82452 0.52928 0.48837 0.52785 0.64918 0.52744 0.74148 0.52817 0.56110 0.52986 0.60641 0.52860 0.85399 0.52751 0.64155 0.52902 0.71859 0.52862 0.79750 0.47512 0.39432 0.47682 0.54238 0.47676 0.61047 0.47703 0.46058 0.47725 0.49540 0.47672 0.71585 0.47670 0.52594 0.47545 0.57554 0.47621 0.65009 0.42337 0.35592 0.42297 0.47339 0.42388 0.53837 0.42451 0.40596 0.42382 0.44091 0.42409 0.62686 0.42292 0.47364 0.42370 0.51232 0.42389 0.57128 0.37149 0.34266 0.37032 0.44424 0.37049 0.50311 0.37115 0.37989 0.37047 0.43382 0.37154 0.58383 0.37029 0.44111 0.37191 0.47596 0.37121 0.54043 0.31875 0.32863 0.31970 0.42013 0.31921 0.47764 0.31873 0.35644 0.31887 0.41725 0.31890 0.54461 0.31998 0.41138 0.31810 0.44343 0.31909 0.51056 0.26657 0.31301 0.26676 0.39625 0.26736 0.44988 0.26635 0.33278 0.26695 0.39354 0.26642 0.50514 0.26731 0.39003 0.26571 0.41226 0.26616 0.48297 0.21377 0.29756 0.21452 0.37110 0.21449 0.41988 0.21369 0.30842 0.21449 0.36812 0.21383 0.47206 0.21525 0.37355 0.21411 0.38516 0.21382 0.46409 0.16151 0.27705 0.16179 0.34426 0.16182 0.38772 0.16121 0.28295 0.16176 0.33747 0.16146 0.42997 0.16209 0.33616 0.16100 0.35096 0.16301 0.43228 0.10878 0.25278 0.10895 0.31235 0.10950 0.35235 0.10877 0.25381 0.10885 0.30435 0.10876 0.38485 0.10919 0.29616 0.11001 0.31452 0.11064 0.39100 0.05653 0.22406 0.05684 0.27361 0.05732 0.30823 0.05690 0.21775 0.05691 0.26497 0.05681 0.33014 0.05689 0.24884 0.05772 0.26842 0.05782 0.33895 0.00473 0.15180 0.00480 0.18524 0.00499 0.21097 0.00496 0.14048 0.00466 0.17266 0.00492 0.22366 0.00469 0.15878 0.00485 0.17018 0.00489 0.22263
下载: 导出CSV
表 4 页岩样品的正交试验孔隙结构参数
Table 4 Pore structure parameters of shale samples by orthogonal test
参数 ZJ-1 ZJ-2 ZJ-3 ZJ-4 ZJ-5 ZJ-6 ZJ-7 ZJ-8 ZJ-9 比表面积(m2/g) 0.677 1.009 1.089 0.881 0.807 1.143 0.777 1.054 1.080 孔体积(cm3/g) 0.01338 0.01598 0.01261 0.009143 0.007585 0.01844 0.01028 0.01922 0.04916 平均孔径(nm) 79.12 63.35 46.32 41.49 39.04 64.52 52.92 72.95 182.0
下载: 导出CSV
-
Yin Y, Qu Z G, Zhang J F.An analytical model for shale gas transport in kerogen nanopores coupled with real gas effect and surface diffusion[J].Fuel, 2017, 210:569-577. doi: 10.1016/j.fuel.2017.09.018
Wang P, Jiang Z, Ji W, et al.Heterogeneity of intergra-nular, intraparticle and organic pores in Longmaxi shale in Sichuan Basin, South China:Evidence from SEM digital images and fractal and multifractal geometries[J].Marine and Petroleum Geology, 2016, 72:122-138. doi: 10.1016/j.marpetgeo.2016.01.020
Tian H, Pan L, Zhang T, et al.Pore characterization of organic-rich Lower Cambrian shales in Qiannan Depression of Guizhou Province, Southwestern China[J].Marine and Petroleum Geology, 2015, 62:28-43. doi: 10.1016/j.marpetgeo.2015.01.004
Jiao K, Yao S, Liu C, et al.The characterization and quantitative analysis of nanopores in unconventional gas reservoirs utilizing FESEM-FIB and image processing:An example from the lower Silurian Longmaxi shale, Upper Yangtze region, China[J].International Journal of Coal Geology, 2014, 128-129:1-11. doi: 10.1016/j.coal.2014.03.004
王羽, 金婵, 汪丽华, 等.应用氩离子抛光-扫描电镜方法研究四川九老洞组页岩微观孔隙特征[J].岩矿测试, 2015, 34(3):278-285. doi: 10.15898/j.cnki.11-2131/td.2015.03.003 Wang Y, Jin C, Wang L H, et al.Characterization of pore structures of Jiulaodong Formation shale in the Sichuan Basin by SEM with Ar-ion milling[J].Rock and Mineral Analysis, 2015, 34(3):278-285. doi: 10.15898/j.cnki.11-2131/td.2015.03.003
Li A, Ding W, He J, et al.Investigation of pore structure and fractal characteristics of organic-rich shale reservoirs:A case study of Lower Cambrian Qiongzhusi Formation in Malong block of Eastern Yunnan Province, South China[J].Marine and Petroleum Geology, 2016, 70:46-57. doi: 10.1016/j.marpetgeo.2015.11.004
Liu J, Li P, Sun Z, et al.A new method for analysis of dual pore size distributions in shale using nitrogen adsorption measurements[J].Fuel, 2017, 210:446-454. doi: 10.1016/j.fuel.2017.08.067
Ji W, Song Y, Rui Z, et al.Pore characterization of isolated organic matter from high matured gas shale reservoir[J].International Journal of Coal Geology, 2017, 174:31-40. doi: 10.1016/j.coal.2017.03.005
Yang R, Hu Q, He S, et al.Pore structure, wettability and tracer migration in four leading shale formations in the Middle Yangtze Platform, China[J].Marine and Petroleum Geology, 2018, 89:415-427. doi: 10.1016/j.marpetgeo.2017.10.010
Bahadur J, Radlinski A P, Melnichenko Y B, et al.Small-angle and ultrasmall-angle neutron scattering (SANS/USANS) study of New Albany shale:A treatise on microporosity[J].Energy and Fuels, 2015, 29(2):567-576. doi: 10.1021/ef502211w
Labani M M, Rezaee R, Saeedi A, et al.Evaluation of pore size spectrum of gas shale reservoirs using low pressure nitrogen adsorption, gas expansion and mercury porosimetry:A case study from the Perth and Canning Basins, Western Australia[J].Journal of Petroleum Science and Engineering, 2013, 112(3):7-16. http://www.sciencedirect.com/science/article/pii/S0920410513003197
Chalmers G R, Bustin R M, Power I M.Characterization of gas shale pore systems by porosimetry, pycnometry, surface area, and field emission scanning electron microscopy/transmission electron microscopy image analyses:Examples from the Barnett, Wood-ford, Haynesville, Marcellus, and Doig units[J].AAPG Bulletin, 2012, 96(6):1099-1119. doi: 10.1306/10171111052
Yang R, He S, Yi J, et al.Nano-scale pore structure and fractal dimension of organic-rich Wufeng-Longmaxi shale from Jiaoshiba area, Sichuan Basin:Investigations using FE-SEM, gas adsorption and helium pycnometry[J].Marine and Petroleum Geology, 2016, 70:27-45. doi: 10.1016/j.marpetgeo.2015.11.019
解德录, 郭英海, 赵迪斐.基于低温氮实验的页岩吸附孔分形特征[J].煤炭学报, 2014, 39(12):2466-2472. http://www.wanfangdata.com.cn/details/detail.do?_type=perio&id=mtxb201412017 Xie D L, Guo Y H, Zhao D F.Fractal characteristics of adsorption pore of shale based on low temperature nitrogen experiment[J].Journal of China Coal Society, 2014, 39(12):2466-2472. http://www.wanfangdata.com.cn/details/detail.do?_type=perio&id=mtxb201412017
Xiong J, Liu X, Liang L.Experimental study on the pore structure characteristics of the Upper Ordovician Wufeng Formation shale in the southwest portion of the Sichuan Basin, China[J].Journal of Natural Gas Science and Engineering, 2015, 22:530-539. doi: 10.1016/j.jngse.2015.01.004
Jiang Z, Zhang D, Zhao J, et al.Experimental investi-gation of the pore structure of Triassic terrestrial shale in the Yanchang Formation, Ordos Basin, China[J].Journal of Natural Gas Science and Engineering, 2017, 46:436-450. doi: 10.1016/j.jngse.2017.08.002
Sun M, Yu B, Hu Q, et al.Pore characteristics of Longmaxi shale gas reservoir in the northwest of Guizhou, China:Investigations using small-angle neutron scattering (SANS), helium pycnometry, and gas sorption isotherm[J].International Journal of Coal Geology, 2017, 171:61-68. doi: 10.1016/j.coal.2016.12.004
Liu K, Ostadhassan M, Zhou J, et al.Nanoscale pore structure characterization of the Bakken shale in the USA[J].Fuel, 2017, 209:567-578. doi: 10.1016/j.fuel.2017.08.034
Hu H, Hao F, Lin J, et al.Organic matter-hosted pore system in the Wufeng-Longmaxi (O3w-S11) shale, Jiaoshiba area, Eastern Sichuan Basin, China[J].International Journal of Coal Geology, 2017, 173:40-50. doi: 10.1016/j.coal.2017.02.004
Wei Z, Wang Y, Wang G, et al.Pore characterization of organic-rich Late Permian Da-long Formation shale in the Sichuan Basin, Southwestern China[J].Fuel, 2018, 211:507-516. doi: 10.1016/j.fuel.2017.09.068
Wang G, Ju Y.Organic shale micropore and mesopore structure characterization by ultra-low pressure N2 physisorption:Experimental procedure and interpretation model[J].Journal of Natural Gas Science and Engineering, 2015, 27:452-465. doi: 10.1016/j.jngse.2015.08.003
Shao X, Pang X, Li Q, et al.Pore structure and fractal characteristics of organic-rich shales:A case study of the Lower Silurian Longmaxi shales in the Sichuan Basin, SW China[J].Marine and Petroleum Geology, 2017, 80:192-202. doi: 10.1016/j.marpetgeo.2016.11.025
Chen Q, Kang Y, You L, et al.Change in composition and pore structure of Longmaxi black shale during oxidative dissolution[J].International Journal of Coal Geology, 2017, 172:95-111. doi: 10.1016/j.coal.2017.01.011
Cao T T, Song Z G, Wang S B, et al.A comparative study of the specific surface area and pore structure of different shales and their kerogens[J].Science China Earth Sciences, 2015, 58(4):510-522. doi: 10.1007/s11430-014-5021-2
Kuila U, Prasad M.Specific surface area and pore-size distribution in clays and shales[J].Geophysical Prospecting, 2013, 61(2):341-362. doi: 10.1111/gpr.2013.61.issue-2
Li Y, Li X, Wang Y, et al.Effects of composition and pore structure on the reservoir gas capacity of Carboniferous shale from Qaidam Basin, China[J].Marine and Petroleum Geology, 2015, 62:44-57. doi: 10.1016/j.marpetgeo.2015.01.011
杨峰, 宁正福, 张世栋, 等.基于氮气吸附实验的页岩孔隙结构表征[J].天然气工业, 2013, 33(4):135-140. doi: 10.3787/j.issn.1000-0976.2013.04.025 Yang F, Ning Z F, Zhang S D, et al.Characterization of pore structures in shale through nitrogen adsorption experiment[J].Natural Gas Industry, 2013, 33(4):135-140. doi: 10.3787/j.issn.1000-0976.2013.04.025
Jiang F, Chen D, Wang Z, et al.Pore characteristic analysis of a Lacustrine shale:A case study in the Ordos Basin, NW China[J].Marine & Petroleum Geology, 2016, 73:554-571. http://www.sciencedirect.com/science/article/pii/S0264817216300903
于炳松.页岩气储层孔隙分类与表征[J].地学前缘, 2013, 20(4):211-220. http://industry.wanfangdata.com.cn/dl/Detail/Conference?id=Conference_8681345 Yu B S.Classification and characterization of gas shale pore system[J].Earth Science Frontiers, 2013, 20(4):211-220. http://industry.wanfangdata.com.cn/dl/Detail/Conference?id=Conference_8681345
Thommes M, Kaneko K, Neimark A V, et al.Physis-orption of gases, with special reference to the evaluation of surface area and pore size distribution[R].IUPAC Technical Report, 2015:1-19.
Yang C, Zhang J, Wang X, et al.Nanoscale pore structure and fractal characteristics of marine-continental transitional shale:A case study from the Lower Permian Shanxi shale in the Southeastern Ordos Basin, China[J].Marine and Petroleum Geology, 2017, 88:54-68. doi: 10.1016/j.marpetgeo.2017.07.021
Fu H, Wang X, Zhang L, et al.Investigation of the factors that control the development of pore structure in lacustrine shale:A case study of Block X in the Ordos Basin, China[J].Journal of Natural Gas Science & Engineering, 2015, 26:1422-1432. http://www.sciencedirect.com/science/article/pii/S1875510015300469
Huang Y, Fan C, Han X, et al.A TGA-MS investigation of the effect of heating rate and mineral matrix on the pyrolysis of kerogen in oil shale[J].Oil Shale, 2016, 33(2):125-141. doi: 10.3176/oil.2016.2.03
Kang Z, Zhao J, Yang D, et al.Study of the evolution of micron-scale pore structure in oil shale at different temperatures[J].Oil Shale, 2017, 34(1):42-54. doi: 10.3176/oil.2017.1.03
康毅力, 陈益滨, 李相臣, 等.页岩粒径对甲烷吸附性能影响[J].天然气地球科学, 2017, 28(2):272-279. doi: 10.11764/j.issn.1672-1926.2017.01.006 Kang Y L, Chen Y B, Li X C, et al.Effect of particle size on methane sorption capacity of shales[J].Nature Gas Geoscience, 2017, 28(2):272-279. doi: 10.11764/j.issn.1672-1926.2017.01.006
Burgess C G V, Everett D H, Nuttall S.Adsorption hysteresis in porous materials[J].Pure and Applied Chemistry, 1989, 61(11):1845-1852. doi: 10.1351/pac198961111845
Sigmund G, Hüffer T, Hofmann T, et al.Biochar total surface area and total pore volume determined by N2 and CO2 physisorption are strongly influenced by degassing temperature[J].Science of the Total Environment, 2016, 580:770-775. http://www.tandfonline.com/servlet/linkout?suffix=cit0189&dbid=8&doi=10.1080%2F10643389.2017.1421844&key=27964990
Liang M, Wang Z, Gao L, et al.Evolution of pore structure in gas shale related to structural deformation[J].Fuel, 2017, 197:310-319. doi: 10.1016/j.fuel.2017.02.035
Brunauer S, Deming L S, Deming W E, et al.On a theory of the van der Waals adsorption of gases[J].Journal of the American Chemical Society, 1940, 62(7):1723-1732. doi: 10.1021/ja01864a025
Sing K S W, Everett D H, Haul W R A, et al.Reporting physisorption data for gas/solid systems with special reference to the determination of surface area and porosity (Recommendations 1984)[J].Pure and Applied Chemistry, 1985, 57(4):603-619. doi: 10.1351/pac198557040603
Tang X, Jiang Z, Li Z, et al.The effect of the variation in material composition on the heterogeneous pore structure of high-maturity shale of the Silurian Longmaxi Formation in the Southeastern Sichuan Basin, China[J].Journal of Natural Gas Science and Engineering, 2015, 23:464-473. doi: 10.1016/j.jngse.2015.02.031
Fan C, Do D D, Nicholson D.On the hysteresis of argon adsorption in a uniform closed end slit pore[J].Journal of Colloid and Interface Science, 2013, 405(9):201-210. http://www.sciencedirect.com/science/article/pii/S0021979713004128
Donaldson E C, Kendall R F, Baker B A, et al.Surface area measurement of geologic material[J].SPE Journal, 1975, 15(2):111-116. doi: 10.2118/4987-PA
陈生蓉, 帅琴, 高强, 等.基于扫描电镜-氮气吸脱附和压汞法的页岩孔隙结构研究[J].岩矿测试, 2015, 34(6):636-642. http://kns.cnki.net/KCMS/detail/detail.aspx?filename=ykcs201506005&dbname=CJFD&dbcode=CJFQ Chen S R, Shuai Q, Gao Q, et al.Analysis of the pore structure of shale in Ordos Basin by SEM with nitrogen gas adsorption-desorption[J].Rock and Mineral Analysis, 2015, 34(6):636-642. http://kns.cnki.net/KCMS/detail/detail.aspx?filename=ykcs201506005&dbname=CJFD&dbcode=CJFQ
王羽, 汪丽华, 王建强, 等.利用纳米CT研究石柱龙马溪组页岩有机孔三维结构特征[J].岩矿测试, 2017, 36(6):580-590. http://kns.cnki.net/KCMS/detail/detail.aspx?filename=ykcs20171128001&dbname=CJFD&dbcode=CJFQ Wang Y, Wang L H, Wang J Q, et al.Investigation of organic matter pore structures of Longmaxi Shale in Shizhu area in three dimensions using nano-CT[J].Rock and Mineral Analysis, 2017, 36(6):580-590. http://kns.cnki.net/KCMS/detail/detail.aspx?filename=ykcs20171128001&dbname=CJFD&dbcode=CJFQ
聂海宽, 张金川, 马晓彬, 等.页岩等温吸附气含量负吸附现象初探[J].地学前缘, 2013, 20(6):282-288. http://www.wanfangdata.com.cn/details/detail.do?_type=perio&id=dxqy201306031 Nie H K, Zhang J C, Ma X B, et al.A preliminary study of negative adsorption phenomena of shale adsorption gas content by isothermal adsorption[J].Earth Science Frontiers, 2013, 20(6):282-288. http://www.wanfangdata.com.cn/details/detail.do?_type=perio&id=dxqy201306031
-
期刊类型引用(12)
1. 王玲,刘建欣,束浩杰,王宏刚,刘成垚,刘淑贤,聂轶苗,韩秀丽. 河北某铅锌尾矿库周边土壤重金属元素空间分布及风险评价. 金属矿山. 2025(03): 253-261 .  百度学术
百度学术
2. 张雅静. 农田土壤重金属污染风险及治理措施研究. 环境科学与管理. 2024(01): 67-71 . 百度学术
3. 汪明星,廖传华,曾祥荣,刘胜敏,王银峰. 铁尾矿中重金属去除技术研究进展. 矿冶. 2024(01): 86-95 . 百度学术
4. 郭学辉,黄仁亮,万建华. 冀北山区某有色多金属尾矿库周边农用地重金属污染特征与生态健康风险评价. 地学前缘. 2024(02): 77-92 . 百度学术
5. 鲁银鹏,孟郁苗,黄小文,王丛林,杨秉阳,谭侯铭睿,谢欢. 宁芜盆地玢岩型铁矿尾矿元素与矿物组成特征. 岩矿测试. 2024(02): 259-269 . 本站查看
6. 刘强,胡建,宫少军,罗锋,杨贵芳. 江苏南京沿江地区土壤-底泥重金属Cd富集特征及风险评价. 地质通报. 2024(05): 756-765 . 百度学术
7. 王志勇. 农田土壤重金属污染的评估及治理措施研究. 中国锰业. 2024(03): 103-107 . 百度学术
8. 吴超,孙彬彬,成晓梦,刘冬,乔宇,贺灵,曾道明. 基于DGT和化学提取法研究浙西北地质高背景区土壤镉生物有效性. 岩矿测试. 2023(04): 823-838 . 本站查看
9. 汪易坤. 地表径流中重金属的污染特征分析——以乌鲁木齐市为例. 资源节约与环保. 2023(11): 18-22 . 百度学术
10. 冯娟,艾昊,陈清敏,李华,汪文波,薛智凤. 秦岭山区某金属矿区土壤重金属污染评价及迁移路径解析. 岩矿测试. 2023(06): 1189-1202 . 本站查看
11. 冯娟,艾昊,陈清敏,赵鹏鹤,李华,汪文波,薛智凤. 金属矿区土壤重金属污染的分布特征及因果关系解析——以某金矿为例. 农业环境科学学报. 2023(12): 2721-2730 . 百度学术
12. 钱江波,陈涤,王夏晖,李喜林,黄国鑫. 基于机器学习的区域土壤重金属污染风险诊断. 环境工程. 2023(12): 296-303 . 百度学术
其他类型引用(6)
-
其他相关附件


计量
- 文章访问数: 1898
- HTML全文浏览量: 486
- PDF下载量: 74
- 被引次数: 18
 京公网安备 11010202008159号