
Distribution Characteristics, Ecological Risks, and Source Identification of Heavy Metals in Cultivated Land in Xingyang City
-
摘要:
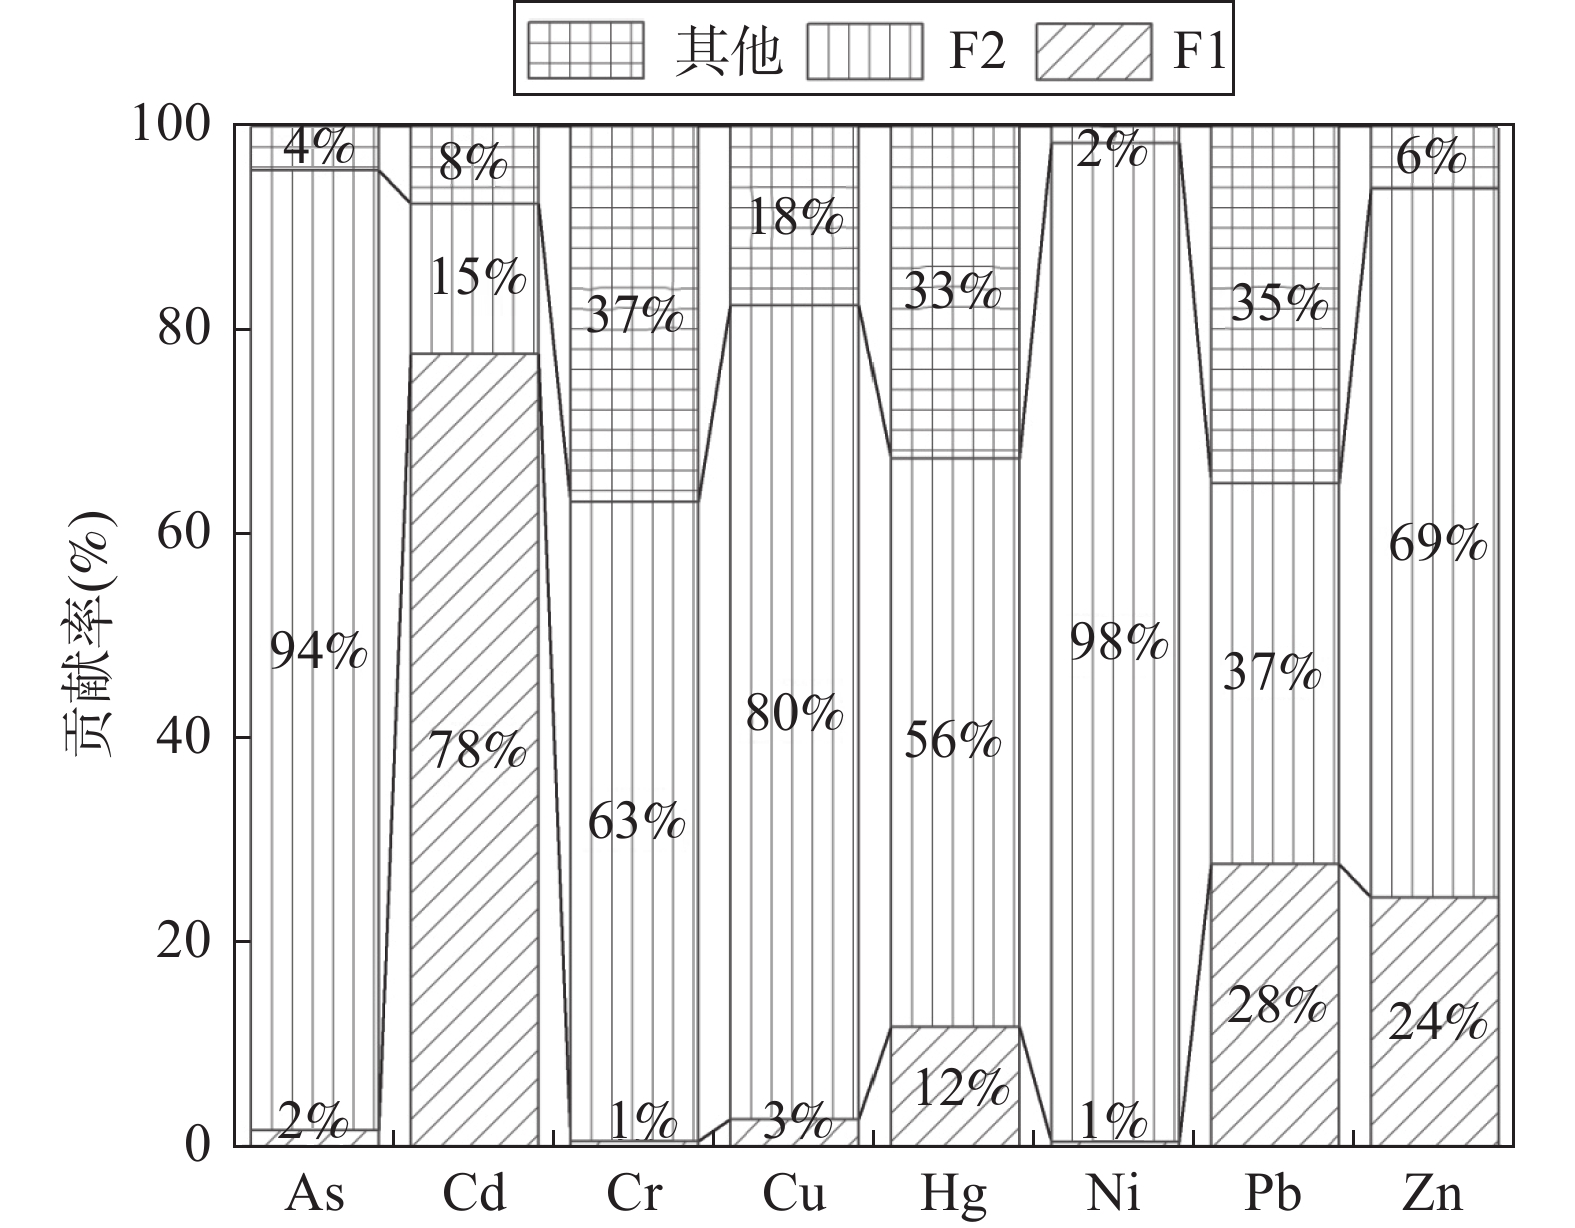
耕地质量关系着人民生活,而重金属是影响耕地质量的重要因素之一。根据全国土壤污染状况调查显示,中国耕地环境状况不容乐观,对耕地的重金属调查分析迫在眉睫。但仅简单地对重金属含量水平及来源类型进行判断已不足以为区域土壤重金属污染治理提供支持,而通过对各类污染源贡献率的定量计算,不仅可以明确农田土壤重金属分布特征,同时可判别污染源类别及来源,从而识别优先控制的污染元素,为重金属污染精准管控提供关键信息。本文采集河南荥阳市耕地表层土壤样品(0~20cm),应用电感耦合等离子体质谱和发射光谱法(ICP-MS/OES)、原子荧光光谱法(AFS)及离子选择电极法(IES)对As、Cd、Cr、Cu、Hg、Ni、Pb、Zn等8种重金属进行测试和pH分析;利用多元统计、绝对因子分析-多元线性回归(APCS-MLR)受体模型探讨研究区8种重金属污染含量空间分布特征及来源,利用富集因子和地累积指数开展土壤污染评价。结果表明:①耕地土壤中重金属含量整体偏高。除Cr外,其他元素为郑州市土壤背景值的1.04~1.40倍,其中Cd的累积效应较明显。②研究区重金属高值区主要分布于荥阳市城区周边。③基于富集因子法、相关性分析、主成分分析及APCS-MLR源解析结果显示,研究区重金属主要有三个来源:自然源对Ni、As、Cu、Cr的贡献率分别为98%、94%、80%及63%;工业源对Cd的贡献率为78%;其他源则主要是农业化肥源、燃煤源的混合源,对Cr、Pb、Hg的贡献率分别为37%、35%及33%。④地累积指数表明,研究区各重金属以无污染为主,而Cd超标率最高,其中度、中-重度污染、重度污染样点数分别为19个、5个及3个,并存在1个极重度污染样点。综上,Cd在研究区耕地中富集较明显,为潜在的主要污染元素;工业源、自然源、农业化肥源及燃煤源是重金属的主要来源,表明人类活动已对研究区耕地产生影响,需采取措施避免该影响进一步加剧。

-
关键词:
- 耕地土壤重金属 /
- 来源解析 /
- 绝对因子分析-多元线性回归(APCS-MLR)受体模型 /
- 风险评价 /
- 荥阳
要点(1)除Cr外,研究区各重金属元素在表层土壤中呈富集趋势。
(2)研究区各重金属元素以无污染为主;Cd元素重度污染样点数为3个,极重度污染样点数1个,为主要的潜在污染物。
(3)工业源、自然源、农业化肥及燃煤源的方差贡献率分别为44.45%、21.93%、11.34%,是研究区重金属的三个主要来源。
HIGHLIGHTS(1) All heavy metal elements except Cr exhibit an enrichment trend in surface soil.
(2) The predominant status for each heavy metal element in the study area is uncontaminated. However, the Cd element has 3 points with heavy contamination and 1 point with extremely heavy contamination, making it a primary potential pollutant.
(3) The variance contribution rates of industrial sources, natural sources, as well as agricultural fertilizer and coal burning sources are 44.45%, 21.93% and 11.34%, respectively, which are the three main sources of heavy metals in the study area.
Abstract:The quality of arable land is closely related to people’s livelihoods, and heavy metals are one of the significant factors affecting arable land quality. The spatial distribution characteristics and sources of eight heavy metal pollutants in the cultivated land of Xingyang City were investigated by multivariate statistical analysis and absolute principal component score-multiple linear regression (APCS-MLR) receptor model, and soil pollution assessment was carried out by enrichment factor and land accumulation index. The results show that the heavy metal content in cultivated soil was higher as a whole, and the accumulation effect of Cd was more obvious. The heavy metals in the study area were mainly distributed around Xingyang City. Industrial, natural, and the mixed sources of agricultural fertilizer and coal-burning are the main sources of heavy metals. The accumulative index shows that the heavy metals in the study area are mainly unpolluted, and the Cd exceeding standard rate is the highest. Therefore, it indicates that human activities have affected the cultivated land in the study area, and measures should be taken to avoid further aggravation. The BRIEF REPORT is available for this paper at http://www.ykcs.ac.cn/en/article/doi/10.15898/j.ykcs.202306300084.
-
Keywords:
- heavy metals in cultivated soil /
- source analysis /
- absolute principal component score-multiple linear regression (APCS-MLR) receptor model /
- risk assessment /
- Xingyang
BRIEF REPORTSignificance: Arable soil serves as a crucial medium for agricultural production, with its quality directly impacting people’s livelihoods. Heavy metals represent the primary pollutants that adversely affect the environmental quality of arable land. Characteristics such as non-degradability, strong persistence, and accumulation make soil heavy metals a significant threat, as they can be absorbed by crops and subsequently enter the human body through the food chain, posing risks to human health[1]. The sources of soil heavy metals are complex, encompassing both natural and anthropogenic origins[9]. Analyzing the origins of pollution sources is a crucial prerequisite for the assessment, prevention, and control of soil heavy metal pollution[10]. This has practical significance in implementing the national strategies of “scientific pollution control” and “precision pollution control”. Henan Province is the main wheat producing area in China, with both its planting area and wheat yield ranking at the top nationally, so local agricultural products and eco-environmental security have been widely concerned. In the research, the distribution characteristics and pollution status of heavy metals in farmland soil in Henan province was clarified, and the relative contribution rate of various pollution sources to the accumulation of elements was calculated. It is of great significance to the assessment of agricultural ecological environment and the safety of food and residents.
Methods: The current study was conducted throughout the entire Xingyang City, with a working area covering 365.78km. Surface soil samples were collected at a depth of 0-20cm, and a total of 2113 samples were analyzed. Surface soil samples (0-20cm) were collected, and eight heavy metals (As, Cd, Cr, Cu, Hg, Ni, Pb, Zn) and pH were analyzed using inductively coupled plasma-mass spectrometry (ICP-MS), inductively coupled plasma-optical emission spectrometry (ICP-OES), atomic fluorescence spectrometry (AFS), and ion-selective electrode method (IES). Multiple statistical analyses, spatial distribution mapping, and methods such as enrichment factor (EF) and geo-accumulation index (Igeo) were employed to analyze the degree of soil pollution. We also utilized principal component analysis (PCA), an absolute principal component score-multiple linear regression (APCS-MLR) receptor models, and other methods, to quantify the contribution rates of various influencing factors, thus identifying the main pollution sources in the research area.
Data and Results: (1) Overall distribution characteristics. The average concentrations of eight heavy metal elements (Table 2) were as follows: As (10.61mg/kg), Cd (0.21mg/kg), Cr (61.21mg/kg), Cu (20.74mg/kg), Hg (0.04mg/kg), N (26.15mg/kg), Pb (23.70mg/kg), and Zn (65.70mg/kg). In comparison with the soil background values of Zhengzhou City, the overall heavy metal concentrations in the study area were relatively high, with ratio ranges from 1.04 to 1.40. Notably, the concentration of Cr was lower, at only 0.89 times the background value of Zhengzhou City. These results indicate a degree of accumulation of some heavy metals in the arable land of Xingyang City.
Coefficient of variation (CV) reflects the degree of spatial variability of heavy metals. The larger the CV value, the more uneven the distribution of heavy metals[21] . The order of CV of 8 heavy metal elements in the study area is: Cr<Ni<As<Cu<Zn<Pb<Hg<Cd. Cd and Hg were highly variable (CV≥0.36), with CV of 0.89 and 0.71, respectively. Cu, Pb and Zn were moderately variable (0.16≤CV<0.36), while As, Cr and Ni were low variable (CV<0.16), the CV of Cr was only 0.096, which indicates that the spatial distribution of Cr is uniform and less affected by humans. Compared with the soil pollution risk control standard of agricultural land, the average content of 8 heavy metal elements in the study area was lower than the risk screening value, but the values of Cd, Pb and Zn were still higher than the risk screening value. The order of the number of samples exceeding the risk screening value was as follows: Cd (13 samples)>Zn (3 samples)>Pb (1 sample), showing that there was a certain risk of Cd pollution in cultivated soil in the study area.
(2) Spatial distribution characteristics. Among the eight soil heavy metals, Cd, Hg, Pb, and Zn exhibited a similar distribution pattern, forming a high-value zone in the central part of the study area, particularly around the periphery of Xingyang City. The high-value zone for Ni was exclusively in the northern part of the research area. Cr and Ni were primarily influenced by parent material, thus showing less disturbance by human activities. Sporadic high-value zones for As and Cu were scattered in the northern part of the research area and around Xingyang City.
(3) Pollution assessment. The Enrichment Factors (EF) were ranked from highest to lowest as follows (Fig.3): EFCd (1.86)>EFZn (1.57)>EFAs (1.53)>EFCu (1.46)>EFNi (1.44)=EFPb (1.44)>EFHg (1.40)>EFCr (1.21). This indicates that Cu, Ni, Pb, Hg, and Cr were primarily influenced by natural soil process. Cd, As, and Zn showed enrichment, especially with Cd being significantly impacted by anthropogenic disturbances.
The Geo-accumulation Index reveals that the number of non-contaminated sample points for As, Cd, Cr, Cu, Hg, Ni, Pb, and Zn were 2059, 1556, 2112, 2057, 1841, 2090, 2079, and 2000, respectively (Table 3). The majority of heavy metal samples in the study area were non-contaminated, with Cd exhibiting the highest pollution level and the presence of extremely contaminated sample points, making it a primary potential pollutant in the research area.
(4) Source analysis. Through Pearson correlation analysis, it is evident that there were highly significant positive correlations (P<0.01) between As-Ni, As-Cu, Cd-Pb, Cd-Zn, Cu-Ni, Cu-Zn, and Pb-Zn, with Cd-Pb and Cd-Zn reaching as high as 0.89 and 0.82, respectively (Fig.4). After Kaiser normalization and Varimax orthogonal rotation of the factors, three principal components with eigenvalue greater than 0.9 were identified, measuring 3.556, 1.755, and 0.907, respectively. The variance contribution rates were 44.45%, 21.93%, and 11.34%, resulting in a cumulative contribution rate of 77.72%. The results of both correlation and principal component analyses indicate that heavy metals in the study area can be categorized into three groups: F1 (Zn, Pb, Cd, Cu); F2 (Ni, As, Cr); F3 (Hg). F1 is mainly affected by industrial production activities; F2 is mainly affected by weathering of parent rock and F3 can be classified as “remote atmospheric transport”.
The results of the APCS-MLR receptor model indicate that Cd constitutes a relatively high proportion, with a contribution rate of 78% (Fig.5). Previous studies suggested that external sources of Cd primarily include industrial emissions and fossil fuel combustion[29], automobile exhaust and traffic dust[30], as well as pesticides and fertilizers[31-32]. The high-value areas of Cd in the study area overlap with the distribution of industrial enterprises, thus identifying F1 as an industrial source. The deposition of atmospheric Hg, through both dry and wet processes, is considered one of the major contributors to excessive soil Hg content[35]. In the study area, winter heating and cooking predominantly rely on coal combustion, with high-value points of Hg spatially scattered, especially around urban areas. Therefore, other sources can be identified as a mixed source of agricultural fertilizers and coal combustion. Cr, Cu, and Ni are significantly influenced by geochemical factors, mainly originating from geological and natural sources[36-37]. Thus, F2 is considered to represent natural sources. Cr is greatly influenced by geochemical genesis, mainly from geological natural sources[38]. The spatial variability of Cr elements in the study area is small and the enrichment coefficient is mainly distributed between 0.5 and 1.5, indicating that they basically maintain the original background state in the surface soil, mainly controlled by the biogeochemistry of soil environment and soil-forming parent materials, and are little or basically unaffected by human activities[39].
-
石油作为基础性能源产品,对现代国家经济的可持续发展有着重大影响[1]。但随着石油的开发与利用,发生了一些溢油事故[2-3]给环境造成了重大危害[4]。石油类的污染物成分复杂,主要为石油烃和多环芳烃[5],其中石油烃能通过食物链富集而对人体健康造成危害[6],多环芳烃包含危害人体健康的致癌物质[7-8]。因此,对石油类污染物的监测已是环境保护的关注重点之一。2018年国家颁布的《土壤环境质量建设用地土壤污染风险管控标准(试行)》(GB 36600—2018)中将石油烃、多环芳烃等均列为监测项目,并制定了相应的风险筛选值和管控值,对土壤进行风险筛查和分类提供了依据,为生态环境修复提供了有力的技术支撑。
石油类污染物主要以烃类形式存在,碳、氢占比高达95%~99%[9],因此红外分光光度法相较于重量法[10]、紫外分光光度法[11-12]、气相色谱法[13-16]、荧光法[17-18]等,能更全面、准确地检测油类物质的总量,且灵敏度高、不受油品影响[19-20],对低含量油污染土壤测定更加适用[21-22]。石油类的官能团CH3、CH2和CH分别在红外光谱2930cm-1、2960cm-1和3030cm-1处存在伸缩振动,通过这三个波数处的吸光度可以计算出含CH3、CH2和CH基团的烃类含量[23]。现行环境标准《土壤石油类的测定红外分光光度法》(HJ 1051—2019)、《水质石油类和动植物油类的测定红外分光光度法》(HJ 637—2018)采用红外校正系数法计算石油类含量,通过测定正十六烷(CH3)、异辛烷(CH2)和苯(CH)三种烃类在三个波数下的吸光度,联立方程式计算校正因子X、Y、Z和F,利用校正因子来计算石油类含量[24],该计算方式相对复杂,手动计算费时费力;如采用软件计算虽可提高计算效率,但又因实际测试油品的红外光谱吸收峰的偏移,而造成计算结果偏差较大。在《生活饮用水标准检验方法有机物综合指标》(GB/T 5750.7—2006)、被代替的《水质石油类和动植物油的测定红外光度法》(GB/T 16488—1996)和杨斌等[25]、梁庆勋等[26]、马宏伟等[27]研究中均采用了标准曲线法,但国家标准中的标准曲线法采用非色散红外光谱单波数,因未考虑芳香烃的影响而存在局限性,从而导致标准曲线法的适用范围受限或被舍弃[28],而文献[25-27]中均未明确指出具体采用的波数,因此作为简单、方便的标准曲线法是否仍能使用,其计算结果是否具有代表性值得深究。
为解决校正系数法计算复杂、单波数计算范围受限等一系列问题,本文依据CH3、CH2和CH官能团在三个波数下产生的吸光度,组合成5种标准曲线法,计算已知含量的5种配制油品,通过计算结果的比对,确立最佳计算方法为三波数之和标准曲线法。再经过芳香烃占比试验对计算方法适用中国油品的范围进行验证。最后进行实际样品测定,并与校正系数法进行对比,验证其实用性。本文建立的三波数之和标准曲线法,为解决红外分光光度法测定石油类总量中标准曲线法的适用范围扩充提供了参考依据,同时也是对现行校正系数法的有益补充。
1. 实验部分
1.1 仪器和主要试剂
傅里叶变换红外光谱仪(FRONTIER型,美国PerkinElmer公司):扫描范围为2800~3200cm-1;配备4cm带盖石英比色皿。
四氯乙烯(红外光谱级,国药集团化学试剂有限公司)。
1.2 实验样品
标准物质:石油类标准溶液(1000mg/L)、正十六烷(10000mg/L)、异辛烷(10000mg/L)、苯(10000mg/L),均购自上海安谱实验科技股份有限公司。
其他油品:原油(华北油田);高温润滑油(长沙合轩化工科技有限公司);机油(壳牌全合成机油);0#柴油(中国石油化工集团有限公司);92#汽油(中国石油化工集团有限公司)。
实际样品:在工业园区调查项目中分别选取10个污染类型不同、污染程度不一的土壤和水质样品。土壤样品编号为T-1至T-10,水质样品编号为S-1至S-10。
1.3 标准曲线的绘制
将1000mg/L石油类标准溶液用四氯乙烯稀释成150、100、50、20、10、5、2mg/L标准系列,用4cm石英比色皿进行红外光谱扫描,记录2930cm-1、2960cm-1、3030cm-1处的吸光度值。
1.3.1 单波数标准曲线绘制
依据标准溶液浓度与2930cm-1、2960cm-1、3030cm-1处的吸光度分别绘制三条标准工作曲线。
1.3.2 两波数吸光度之和标准曲线绘制
依据标准溶液浓度与2930cm-1、2960cm-1处的吸光度之和绘制标准工作曲线。
1.3.3 三波数吸光度之和标准曲线绘制
依据标准溶液浓度与2930cm-1、2960cm-1、3030cm-1处的吸光度之和绘制标准工作曲线。
1.4 样品分析测试
1.4.1 配制油品
称取原油、润滑油、机油、柴油和汽油样品各0.50g,分别用四氯乙烯定容至50mL,配制成10000mg/L的储备液。再将上述各油品储备液用四氯乙烯稀释成100、50、20、10、5、2mg/L系列溶液,用4cm石英比色皿进行红外光谱扫描,得到红外光谱图,记录2930cm-1、2960cm-1、3030cm-1处的吸光度值。
1.4.2 配制不同浓度芳香烃的样品
以四氯乙烯为溶剂,吸取不同体积的正十六烷、异辛烷和苯标准溶液,按照不同比例配制成溶液,用4cm石英比色皿进行红外光谱扫描,使用三波数之和标准曲线法计算。
1.4.3 样品前处理和红外分光光谱分析
土壤样品:称取土壤样品10.0g于锥形瓶中,加入20mL四氯乙烯,置于振荡器中,振荡提取30min,静置10min后倾出提取液。再用20mL四氯乙烯提取一次,合并提取液并定容50mL。提取液流经填充硅酸镁吸附柱,弃去前5mL滤出液,保留剩余流出液,待测。
水质样品:取500mL水质样品于分液漏斗中,用50mL四氯乙烯分两次萃取,合并萃取液并定容至50mL。取适量萃取液过硅酸镁吸附柱,弃去前5mL滤出液,余下的接入25mL比色管中,用于测定石油类。
测定:以4cm石英比色皿加入四氯乙烯为参比,分别测量提取液的红外光谱图,记录2930cm-1、2960cm-1、3030cm-1处的吸光度值。
2. 结果与讨论
2.1 标准曲线、方法线性范围与检出限
按照1.3节标准曲线绘制步骤进行单波数、两波数吸光度之和与三波数吸光度之和绘制标准曲线,各标准曲线方程与相关系数见表 1,各浓度红外光谱图见图 1。
表 1 标准曲线方程与相关系数Table 1. Standard curve equations and correlation coefficients标准曲线名称 回归方程 相关系数(R) 2930cm-1标准曲线 y=0.0135x+0.015 0.9996 2960cm-1标准曲线 y=0.0078x-0.0041 0.9998 3030cm-1标准曲线 y=0.0011x-0.0013 0.9996 两波数吸光度之和标准曲线 y=0.0214x-0.008 0.9998 三波数吸光度之和标准曲线 y=0.0225x-0.0065 0.9999 如图 1所示,当标准溶液浓度为1mg/L时,红外吸收峰吸光度之和为0.083,虽满足3倍信噪比但峰不明显;当标准溶液浓度为150mg/L时,红外光谱图已出现平顶峰,因此石油类质量浓度在2~100mg/L时与其吸光度呈良好线性关系,相关系数如表 1所示全部大于0.999。以3倍信噪比(S/N)计算,最低检出浓度为1mg/L。
2.2 配制油品分析结果
浓度为100mg/L的5种油品的红外光谱图如图 2所示,不同产地和不同类型的油品,各种烃类的结构和所占比例相差很大,但主要属于CH2、CH3官能团组成的烷烃、环烷烃,CH官能团的芳香烃占比较少,与王玉纯等[23]采集中国不同油田的炼油厂废水进行测定得出芳香烃含量不高的结论相符。
读取上述5种油品各浓度相应波数的吸光度值,分别以2930cm-1、2960cm-1、3030cm-1的单波数标准曲线计算,以两波数吸光度之和标准曲线进行计算,以三波数吸光度之和标准曲线进行计算,得到其相应计算浓度。计算浓度(ρ计)与各油品配制浓度(ρ配)的相对误差(δ)按下列公式进行计算。
$$ \delta {\rm{ = }}\left( {{\rho _{计}} - {\rho _{配}}} \right)/{\rho _{配}} $$ 各油品单波数标准曲线计算结果的相对误差情况如图 3所示。由图 3a可知,原油和柴油的各浓度点相对误差较小,大致分布在20%之内,由此可知原油和柴油相较于其余油品更适合采用2930cm-1标准曲线进行计算。由图 3b可知,润滑油和机油的各浓度点相对误差较小,大致分布在20%之内,由此可知润滑油和机油的主要成分相较于其余油品更适合采用2960cm-1标准曲线进行计算。由图 3c可知,5种油品的各浓度点相对误差均在40%以上,计算浓度与配制浓度相差较大,表明5种油品中CH官能团为主的芳香烃含量较低或不存在[9],与图 2各油品的红外光谱图中3030cm-1峰较低或不存在的测试结果相符。单波数标准曲线的选择性强,不适用于多种类石油污染物的计算。
![]() 图 3 单波数标准曲线法计算各种油品的结果Figure 3. Calculation results of single wave number standard curve method for various oil products
图 3 单波数标准曲线法计算各种油品的结果Figure 3. Calculation results of single wave number standard curve method for various oil products由图 4可知,两波数之和标准曲线法计算各油品结果的相对误差均小于30%,这是因为两波数吸光度之和标准曲线法包括了CH2、CH3两个官能团产生的吸光度(图 4a),三波数吸光度之和标准曲线法包括了CH2、CH3和CH三个官能团产生的吸光度(图 4b),较单波数标准曲线法更全面。两种方法相比较,三波数吸光度之和标准曲线法计算结果的相对误差更小,更接近于配制值,说明虽然芳香烃在石油类中含量较低,但其对总量还是存在一定的影响。所以5种标准曲线法中,三波数吸光度之和标准曲线法是更适合作为计算石油类总量的方法。
![]() 图 4 吸光度之和标准曲线法计算各种油品的结果Figure 4. Calculation results of various oil products by summation of absorbance standard curve method
图 4 吸光度之和标准曲线法计算各种油品的结果Figure 4. Calculation results of various oil products by summation of absorbance standard curve method2.3 石油类污染适用范围验证结果
由2.2节可知单波数标准曲线法的选择性强,不能准确计算所有石油类污染。同样的,标准方法中的单波数非分散红外光度法由于没有考虑到芳香烃类化合物,当油品中芳烃含量超过25%时,该方法的计算结果便会产生较大误差,并不适用[28]。
为验证三波数吸光度之和标准曲线法是否存在这类问题,开展了芳香烃占比试验。表 2的计算结果表明:随着芳香烃占比的增加回收率逐渐降低,当芳香烃占比大于50%时,回收率低于70%。因为中国原油的特点是含蜡较多,属于以烷烃为主的石蜡基石油,芳香烃占比小于30%,通常油品中芳香烃含量一般不超过15%[9],所以三波数吸光度之和标准曲线法可适用于中国石油类污染的检测。
表 2 芳香烃占比试验结果Table 2. Results of the proportion test for aromatic hydrocarbons三种烃比例(正十六烷∶异辛烷∶苯) 芳香烃占比(%) 配制浓度(mg/L) 三波数之和标准曲线法 计算值(mg/L) 回收率(%) 7 ∶ 3 ∶ 0 0 50.00 59.98 119.96 6 ∶ 3 ∶ 1 10 50.00 55.42 110.83 6 ∶ 2 ∶ 2 20 50.00 52.93 105.86 5 ∶ 2 ∶ 3 30 50.00 46.70 93.39 5 ∶ 1 ∶ 4 40 50.00 43.66 87.32 3 ∶ 2 ∶ 5 50 50.00 36.55 73.10 3 ∶ 1 ∶ 6 60 50.00 33.47 66.94 2 ∶ 1 ∶ 7 70 50.00 28.24 56.48 1 ∶ 1 ∶ 8 80 50.00 22.43 44.86 1 ∶ 0 ∶ 9 90 50.00 18.65 37.29 0 ∶ 0 ∶ 10 100 50.00 13.85 27.69 2.4 方法精密度和准确度
对空白水和空白土壤(石英砂)进行加标试验,共三个浓度水平,每个浓度水平平行进行6次测定,按照1.4节进行样品前处理、三波数之和标准曲线法计算测定结果,计算其精密度与加标回收率,结果见表 3。方法精密度(RSD)在5.9%~8.0%之间,均小于10%,加标回收率在76.4%~98.2%之间,符合HJ 1051—2019、HJ 637—2018中回收率70%~110%的要求。
表 3 空白加标样品精密度结果Table 3. Precision results of blank spiked samples测定次数 土壤空白加标样品石油类物质含量(mg/kg) 水质空白加标样品石油类物质含量(mg/kg) 10mg/kg 50mg/kg 100mg/kg 0.10mg/L 0.50mg/L 2.50mg/L 1 9.11 47.6 93.4 0.0823 0.458 2.36 2 7.93 48.3 92.5 0.0764 0.403 2.13 3 9.29 47.4 91.6 0.0951 0.471 2.08 4 8.26 49.1 94.1 0.0876 0.427 2.41 5 8.74 45.7 95.7 0.0811 0.452 2.24 6 7.73 48.2 90.6 0.0798 0.485 2.33 平均值 8.51 47.7 93 0.0837 0.45 2.26 回收率(%) 77.3~92.9 91.4~98.2 91.6~95.7 76.4~95.1 80.6~97.0 83.2~96.4 RSD(%) 7.5 6.7 5.9 8.0 6.7 5.9 2.5 实际样品测定结果
按照本文的实验方法(三波数吸光度之和标准曲线法)对采集的土壤和水实际样品(1.2节)进行测定,将三波数吸光度之和标准曲线法计算结果与标准方法HJ 637—2018、HJ 1051—2019中的校正系数法计算结果进行对比。如表 4所示,对于实际土壤样品两种测试结果的相对偏差在0.5%~4.8%,水样品的相对偏差在-5.3%~6.7%,
表 4 实际样品的计算结果对比Table 4. Comparison of calculation results for actual samples土壤样品编号 土壤样品中石油类物质含量(mg/kg) 水样品编号 水样品中石油类物质含量(mg/L) 校正系数法
(标准方法)三波数之和标准曲线法
(本文方法)相对偏差
(%)校正系数法
(标准方法)三波数之和标准曲线法
(本文方法)相对偏差
(%)T-1 17.4 18.5 -3.1 S-1 0.08 0.07 6.7 T-2 9.73 9.82 -0.5 S-2 0.11 0.12 -4.3 T-3 87.9 90.9 -1.7 S-3 0.09 0.1 -5.3 T-4 104 94.8 4.6 S-4 0.67 0.65 1.5 T-5 374 393 -2.5 S-5 0.88 0.92 -2.2 T-6 646 689 -3.2 S-6 0.79 0.84 -3.1 T-7 1235 1304 -2.7 S-7 1.25 1.18 2.9 T-8 1647 1723 -2.3 S-8 1.34 1.26 3.1 T-9 5386 5839 -4.0 S-9 1.87 1.67 5.6 T-10 20880 22342 -3.4 S-10 2.07 2.14 -1.7 注:相对偏差=(推荐方法测定值-两次测定值的平均值)/两次测定值平均值×100%。 参考HJ 1051—2019中土壤平行样的相对偏差≤30%、HJ 637—2018中水样实验室内标准偏差的范围为0.8%~13%,测试结果满足要求,因此三波数吸光度之和标准曲线法可作为实际测定石油类总量的方法。
3. 结论
本文建立了三波数之和标准曲线法计算环境样品中石油类总量的方法。依据标准曲线法原理和常见油品红外谱图,对红外分光光度法测定石油类的三个波数处的吸光度进行排列组合,组建出5种标准曲线法计算已知含量的5种油品,并进行结果比对,表明三波数之和标准曲线法包含的波数全面,结果更接近实际配制值,是标准曲线法中的最佳计算方法。再经过芳香烃占比试验和实际样品验证,表明本文方法在芳香烃占比小于50%时,与校正系数法结果相一致,能满足石油类污染的测定需求。
三波数之和标准曲线法的建立,解决了标准曲线法在红外分光光度法测定石油类总量中的应用难题,突破了单波数标准曲线法的局限性,同时具有简单、方便、准确等特点,是对现行校正系数法的有益补充。但对于芳香烃占比大于50%的石油类污染,计算结果偏差较大,需进一步探讨研究。
-
![]()
图 1 研究区(a)工业企业分布和(b)土壤类型及采样点位
Figure 1. (a) The geographic location of industrial enterprise; (b) Soil types and sampling site of the study area
![]()
图 2 研究区土壤重金属空间分布
Figure 2. Spatial distributions of heavy metals in soil of the study area.
![]()
图 3 研究区土壤重金属富集因子分布箱式图
Figure 3. Box diagram of enrichment factor distribution for heavy metals in soil of the study area.
![]()
图 4 研究区土壤重金属富集相关性系数矩阵和PCA成分
Figure 4. Correlation plot and PCA plot of heavy metals in soil of the study area.
![]()
图 5 研究区土壤重金属污染贡献率
Figure 5. Source contribution ratios of heavy metals in soil of the study area.
表 1 分析方法质量监控
Table 1 Quality control of analysis method
元素 分析方法 检出限
(mg/kg)准确度
(△lgC)RSD
(%)报出率
(%)As AFS 0.2 0.008 2.84 100 Cd ICP-MS 0.03 0.010 4.64 100 Cr ICP-OES 2 0.011 2.58 100 Cu ICP-MS 0.3 0.006 5.39 100 Hg AFS 0.0005 0.003 5.53 100 Ni ICP-MS 0.3 0.005 5.19 100 Pb ICP-MS 0.3 0.014 3.75 100 Zn ICP-OES 1 0.004 4.17 100 Fe2O3 ICP-OES 0.05(%) 0.006 1.88 100 pH IES 0.1(无量纲) 0.009 4.91 100  下载: 导出CSV
表 2 研究区表层土壤重金属含量统计
Table 2 Heavy metal concentrations in surface soil of the study area
统计项目 pH As
(mg/kg)Cd
(mg/kg)Cr
(mg/kg)Cu
(mg/kg)Hg
(mg/kg)Ni
(mg/kg)Pb
(mg/kg)Zn
(mg/kg)算术平均值 8.22 10.61 0.21 61.21 20.74 0.047 26.15 23.70 65.70 几何平均值 8.22 10.52 0.20 60.94 20.54 0.041 26.00 23.32 64.29 中位数 8.21 10.40 0.20 60.80 20.20 0.041 25.60 23.10 62.90 众数 8.25 10.20 0.19 59.60 19.80 0.034 24.70 23.40 57.40 算术标准差 0.22 1.45 0.19 5.86 3.23 33.30 2.99 8.05 20.34 几何标准差 1.03 1.14 1.36 1.10 1.14 1.62 1.11 1.16 1.20 最大值 9.17 21.00 7.29 120.00 70.10 0.87 47.30 344.50 645.00 最小值 6.85 4.80 0.08 39.50 11.60 0.0089 14.80 16.40 37.70 变异系数 0.03 0.14 0.89 0.10 0.16 0.71 0.11 0.34 0.31 偏度 −0.0056 1.28 27.08 1.08 3.74 9.71 1.71 30.88 14.47 峰度 0.72 4.68 955.90 7.36 34.81 193.50 5.73 1202.63 345.98 郑州市背景值 8.11 9.42 0.15 68.82 19.20 0.045 24.71 22.17 56.73 风险筛选值 6.5~7.5 30 0.3 200 100 2.4 100 120 250 pH>7.5 25 0.6 250 100 3.4 190 170 300
下载: 导出CSV
表 3 研究区表层土壤重金属地累积指数
Table 3 Geo-accumulation index of heavy metals in soil of the study area.
重金属元素 地累积指数
(Igeo)范围污染程度的样点数(个) 无污染 轻度污染 中度污染 中-重度污染 重度污染 重-极重污染 极重污染 As −1.56~0.57 2059 54 0 0 0 0 0 Cd −1.45~5.02 1556 529 19 5 3 0 1 Cr −1.39~0.21 2112 1 0 0 0 0 0 Cu −1.31~1.28 2057 55 1 0 0 0 0 Hg −2.92~3.69 1841 248 20 3 1 0 0 Ni −1.32~0.35 2090 23 0 0 0 0 0 Pb −1.02~3.37 2079 32 1 0 1 0 0 Zn −1.17~2.92 2000 105 7 1 0 0 0
下载: 导出CSV
表 4 研究区表层土壤重金属主成分分析矩阵
Table 4 Principal component analysis matrix of heavy metals in surface soil of the study area.
重金属元素
及指标变量在各主成分上的因子载荷 第一主成分 第二主成分 第三主成分 As 0.565 0.496 −0.383 Cd 0.775 −0.563 −0.157 Cr 0.451 0.479 0.325 Cu 0.701 0.431 0.194 Hg 0.553 −0.148 0.696 Ni 0.565 0.653 −0.228 Pb 0.790 −0.455 −0.237 Zn 0.832 −0.349 −0.017 初始特征值 3.556 1.755 0.907 方差贡献率(%) 44.45 21.93 11.34 累计方差贡献率(%) 44.45 66.38 77.72
下载: 导出CSV
表 5 绝对因子分析-多元线性回归(APCS-MLR)受体模型
Table 5 Absolute principal component score-multiple linear regression (APCS-MLR) receptor model
重金属元素 受体模型 R2 As C(As)=−0.498+0.219APCSF1+1.058APCSF2 0.553 Cd C(Cd)=0.016+0.181APCSF1+0.003APCSF2 0.917 Cr C(Cr)=22.498+0.404APCSF1+3.719APCSF2 0.406 Cu C(Cu)=−5.596+0.967APCSF1+2.47APCSF2 0.673 Hg C(Hg)=−43.78+17.641APCSF1+7.262APCSF2 0.327 Ni C(Ni)=−0.452+0.159APCSF1+2.566APCSF2 0.739 Pb C(Pb)=8.283+7.291APCSF1+0.856APCSF2 0.831 Zn C(Zn)=4.034+17.793APCSF1+4.422APCSF2 0.813
下载: 导出CSV
-
[1] 于林松, 万方, 范海印, 等. 姜湖贡米产地土壤重金属空间分布、源解析及生态风险评价[J]. 环境科学, 2022, 43(8): 4199−4211. Yu L S, Wan F, Fan H Y, et al. Spatial distribution, source apportionment, and ecological risk assessment of soil heavy metals in Jianghugongmi producing area, Shandong Province[J]. Environmental Science, 2022, 43(8): 4199−4211.
[2] 环境保护部, 国土资源部. 全国土壤污染状况调查公报[R]. 2014. Ministry of Environmental Protection, Ministry of Land and Resources. National Soil Pollution Survey Bulletin[R]. 2014.
[3] Chen R S, Sherbinin A D, Ye C, et al. China’s soil pollution: Farms on the frontline[J]. Science, 2014, 344: 691.
[4] 宋绵, 龚磊, 王艳, 等. 河北阜平县表层土壤重金属对人体健康的风险评估[J]. 岩矿测试, 2022, 41(1): 133−144. doi: 10.3969/j.issn.0254-5357.2022.1.ykcs202201013 Song M, Gong L, Wang Y, et al. Risk assessment of heavy metals in topsoil on human health in Fuping County, Hebei Province[J]. Rock and Mineral Analysis, 2022, 41(1): 133−144. doi: 10.3969/j.issn.0254-5357.2022.1.ykcs202201013
[5] 于沨, 王伟, 于扬, 等. 川西九龙地区锂铍矿区土壤重金属分布特征及生态风险评价[J]. 岩矿测试, 2021, 40(3): 408−424. Yu F, Wang W, Yu Y, et al. Distribution characteristics and ecological risk assessment of heavy metals in soils from Jiulong Li-Be mining area, Western Sichuan Province, China[J]. Rock and Mineral Analysis, 2021, 40(3): 408−424.
[6] Zhang J J, Wang Y, Liu J S, et al. Multivariate and geostatistical analyses of the sources and spatial distribution of heavy metals in agricultural soil in Gongzhuling, Northeast China[J]. Journal of Soils Sediment, 2016, 16: 634−644. doi: 10.1007/s11368-015-1225-0
[7] 杨子鹏, 肖荣波, 陈玉萍, 等. 华南地区典型燃煤电厂周边土壤重金属分布、风险评估及来源分析[J]. 生态学报, 2020, 40(14): 4823−4835. Yang Z P, Xiao R B, Chen Y P, et al. Heavy metal distribution, risk assessment and source analysis of soil around a typical coal-fired power plant in South China[J]. Acta Ecologica Sinica, 2020, 40(14): 4823−4835.
[8] 张红桔, 赵科理, 叶正钱, 等. 典型山核桃产区土壤重金属空间异质性及其风险评价[J]. 环境科学, 2018, 39(6): 2893−2903. Zhang H J, Zhao K L, Ye Z Q, et al. Spatial variation of heavy metals in soils and its ecological risk evaluation in a typical Carya cathayensis production area[J]. Environmental Science, 2018, 39(6): 2893−2903.
[9] 尹芳, 封凯, 尹翠景, 等. 青海典型工业区耕地土壤重金属评价及源解析[J]. 中国环境科学, 2021, 41(11): 5217−5226. doi: 10.3969/j.issn.1000-6923.2021.11.030 Yi F, Feng K, Yin C J, et al. Evaluation and source analysis of heavy metal in cultivated soil around typical industrial district of Qinghai Province[J]. China Environmental Science, 2021, 41(11): 5217−5226. doi: 10.3969/j.issn.1000-6923.2021.11.030
[10] 魏洪斌, 罗明, 吴克宁, 等. 冀东平原农田土壤重金属污染源分析与风险评价[J]. 土壤通报, 2023, 54(2): 462−472. Wei H B, Luo M, Wu K N, et al. Source analysis and risk assessment of heavy metal pollution in farmland soil in the Eastern Hebei Plain[J]. Chinese Journal of Soil Science, 2023, 54(2): 462−472.
[11] 李文明, 孙朝, 陈霄燕, 等. 青海省典型高山农业区域土壤重金属污染评价及来源探析[J]. 岩矿测试, 2023, 42(3): 598−615. Li W M, Sun Z, Chen X Y, et al. Evaluation and source of heavy metal pollution in surface soils in typical alpine agricultural areas of Qinghai Province[J]. Rock and Mineral Analysis, 2023, 42(3): 598−615.
[12] 陈林, 马琨, 马建军, 等. 宁夏引黄灌区农田土壤重金属生态风险评价及来源解析[J]. 环境科学, 2023, 44(1): 356−366. Chen L, Ma K, Ma J J, et al. Risk assessment and source of heavy metals in farmland soils of Yellow River irrigation area of Ningxia[J]. Environmental Science, 2023, 44(1): 356−366.
[13] 陈丹利, 刘冠男, 行正松, 等. 河南栾川钼铅锌多金属矿集区土壤重金属累积及源解析[J]. 岩矿测试, 2023, 42(4): 839−851. Chen D L, Liu G N, Xing Z S, et al. Accumulation and source apportionment of soil heavy metals in molybdenum-lead-zinc polymetallic ore concentration area of Luanchuan[J]. Rock and Mineral Analysis, 2023, 42(4): 839−851.
[14] 孟晓飞, 郭俊娒, 杨俊兴, 等. 河南省典型工业区周边农田土壤重金属分布特征及风险评价[J]. 环境科学, 2021, 42(2): 900−908. Meng X F, Guo J M, Yang J X, et al. Spatial distribution and risk assessment of heavy metal pollution in farmland soils surrounding a typical industrial area of Henan Province[J]. Environmental Science, 2021, 42(2): 900−908.
[15] 金钰, 叶令帅, 李华威, 等. 河南省柿主产区土壤重金属污染及其生态风险分析[J]. 浙江农林大学学报, 2022, 39(6): 1303−1312. doi: 10.11833/j.issn.2095-0756.20210721 Jin Y, Ye L S, Li H W, et al. Soil heavy metal pollution and its ecological risk analysis in the main Diospyros kaki producing areas of Henan Province[J]. Journal of Zhejiang A & F University, 2022, 39(6): 1303−1312. doi: 10.11833/j.issn.2095-0756.20210721
[16] Deely J M, Fergusson J E. Heavy metal and organic matter concentrations and distributions in dated sediments of a small estuary adjacent to a small urban area[J]. Science of the Total Environment, 1994, 153(1-2): 97−111. doi: 10.1016/0048-9697(94)90106-6
[17] Niencheski L F, Windom H L, Smith R. Distribution of particulate trace metal in Patos Lagoon Estuary (Brazil)[J]. Marine Pollution Bulletin, 1994, 28(2): 96−102. doi: 10.1016/0025-326X(94)90545-2
[18] 贾振邦, 周华, 赵智杰, 等. 应用地积累指数法评价太子河沉积物中重金属污染[J]. 北京大学学报(自然科学版), 2000, 36(4): 525−530. Jia Z B, Zhou H, Zhao Z J, et al. The application of the index of geoaccumulation to evaluate heavy metal pollution in sediments in the Benxi section of the Taizi River[J]. Acta Scientiarum Naturalium Universitatis Pekinensis, 2000, 36(4): 525−530.
[19] 王锐, 邓海, 严明书, 等. 重庆市酉阳县南部农田土壤重金属污染评估及来源解析[J]. 环境科学, 2020, 41(10): 4749−4756. Wang R, Deng H, Yan M S, et al. Assessment and source analysis of heavy metal pollution in farmland soils in Southern Youyang County, Chongqing[J]. Environmental Science, 2020, 41(10): 4749−4756.
[20] 余涛, 杨忠芳, 王锐, 等. 恩施典型富硒区土壤硒与其他元素组合特征及来源分析[J]. 土壤, 2018, 50(6): 1119−1125. Yu T, Yang Z F, Wang R, et al. Characteristics and sources of soil selenium and other elements in typical high selenium soil area of Enshi[J]. Soils, 2018, 50(6): 1119−1125.
[21] 廖书林, 郎印海, 王延松, 等. 辽河口湿地表层土壤中PAHs的源解析研究[J]. 中国环境科学, 2011, 31(3): 490−497. Liao S L, Lang Y H, Wang Y S, et al. Source apportionment of polycyclic aromatic hydrocarbons (PAHs) in the topsoil of Liaohe Estuarine Wetlands[J]. China Environment Science, 2011, 31(3): 490−497.
[22] 刘永林, 雒昆利, 袁余洋. 重庆市江津区表层土壤中稀土元素含量与分布特征[J]. 中国稀土学报, 2020, 38(2): 215−224. Liu Y L, Luo K L, Yuan Y Y. Content and spatial distribution characteristics of rare earth of surface soil in Jiangjin district, Chongqing City[J]. Journal of the Chinese Society of Rare Earths, 2020, 38(2): 215−224.
[23] Kaiser H F. An index of factorial simplicity[J]. Psychometrika, 1974, 39(1): 31-36.
[24] 袁宏, 钟红梅, 赵利, 等. 基于PCA/APCS受体模型的崇州市典型农田土壤重金属污染源解析[J]. 四川环境, 2019, 38(6): 35−43. Yuan H, Zhong H M, Zhao L, et al. Analysis of heavy metal pollution sources of typical farmland soils in Chongzhou City based on PCA/APCS receptor model[J]. Sichuan Environment, 2019, 38(6): 35−43.
[25] Hu Y N, He K, Sun Z H, et al. Quantitative source apportionment of heavy metal(loid)s in the agricultural soils of an industrializing region and associated model uncertainty[J]. Journal of Hazardous Materials, 2020, 19: 14794.
[26] Zhang H, Wang Z F, Zhang Y L, et al. Identification of traffic-related metals and the effects of different environments on their enrichment in roadside soils along the Qinhai—Tibet highwey[J]. Science of the Total Environment, 2015, 521: 160−172.
[27] 田江涛, 赵同阳, 杨万志, 等. 喀喇昆仑岔路口地区发现科马提岩及找矿意义[J]. 新疆地质, 2021, 39(3): 357−364. doi: 10.3969/j.issn.1000-8845.2021.03.001 Wang J T, Zhao T Y, Yang W Z, et al. First identify of komatiites in Karakoram chalukou area and its prospecting significance[J]. Xinjiang Geology, 2021, 39(3): 357−364. doi: 10.3969/j.issn.1000-8845.2021.03.001
[28] Lv J S, Liu Y, Zhuang Z L, et al. Identifying the origins and spatial distributions of heavy metals in soils of Ju Country (Eastern China) using multivariate and geostatistical approach[J]. Journal of Soils and Sediments, 2015, 15(1): 163−178. doi: 10.1007/s11368-014-0937-x
[29] 李强, 曹莹, 何连生, 等. 典型冶炼行业场地土壤重金属空间分布特征及来源解析[J]. 环境科学, 2021, 42(12): 5930−5937. Li Q, Cao Y, He L S, et al. Spatial distribution characteristics and source analysis of soil heavy metals at typical smelting industry sites[J]. Environmental Science, 2021, 42(12): 5930−5937.
[30] 瞿明凯, 李卫东, 张传荣, 等. 基于受体模型和地统计学相结合的土壤镉污染源解析[J]. 中国环境科学, 2013, 33(5): 854−860. doi: 10.3969/j.issn.1000-6923.2013.05.014 Qu M K, Li W D, Zhang C R, et al. Source apportionment of soil heavy metal Cd based on the combination of receptor model and geostatistics[J]. China Environmental Science, 2013, 33(5): 854−860. doi: 10.3969/j.issn.1000-6923.2013.05.014
[31] Li Z Y, Ma Z W, van der Kuijp T J, et al. A review of soil heavy metal pollution from mines in China: Pollution and health risk assessment[J]. Science of the Total Environment, 2014, 468-469: 843−853. doi: 10.1016/j.scitotenv.2013.08.090
[32] Men C, Liu R M, Xu F, et al. Pollution characteristics, risk assessment, and source apportionment of heavy metals in road dust in Beijing, China[J]. Science of the Total Environment, 2018, 612: 138−147. doi: 10.1016/j.scitotenv.2017.08.123
[33] Chen L, Wang G M, Wu S H, et al. Heavy metals in agricultural soils of the Lihe River Watershed, East China: Spatial distribution, ecological risk, and pollution source[J]. International Journal of Environmental Research and Public Health, 2019, 16(12): 1−17.
[34] Zhao S C, Qiu S J, He P. Changes of heavy metals in soil and wheat grain under long-term environmental impact and fertilization practices in North China[J]. Journal of Plant Nutrition, 2018, 41(15): 1970−1979. doi: 10.1080/01904167.2018.1485158
[35] Zhang Z X, Lu Y, Li H P, et al. Assessment of heavy metal contamination, distribution and source identi-fication in the sediments from the Zijiang River, China[J]. Science of the Total Environment, 2018, 645: 235−243. doi: 10.1016/j.scitotenv.2018.07.026
[36] 孙建伟, 贾煦, 刘向东, 等. 豫西金矿集区矿业活动对周边农田土壤重金属影响研究[J]. 岩矿测试, 2023, 42(1): 192−202. doi: 10.3969/j.issn.0254-5357.2023.1.ykcs202301015 Sun J W, Jia X, Liu X D, et al. Influence of mining activities in the gold ore concentration area in Western Henan on the heavy metals in surrounding farmland soil[J]. Rock and Mineral Analysis, 2023, 42(1): 192−202. doi: 10.3969/j.issn.0254-5357.2023.1.ykcs202301015
[37] 陈雅丽, 翁莉萍, 马杰, 等. 近十年中国土壤重金属污染源解析研究进展[J]. 农业环境科学学报, 2019, 38(10): 2219−2238. doi: 10.11654/jaes.2018-1449 Chen Y L, Weng L P, Ma J, et al. Review on the last ten years of research on source identification of heavy metal pollution in soils[J]. Journal of Agro-Environment Science, 2019, 38(10): 2219−2238. doi: 10.11654/jaes.2018-1449
[38] 刘孝严, 樊亚男, 刘鹏, 等. 基于文献计量分析的长江经济带农田土壤重金属污染特征[J]. 环境科学, 2022, 43(11): 5169−5179. Liu X Y, Fan Y N, Liu P, et al. Characteristics of heavy metal pollution in farmland soil of the Yangtze River Economic Belt based on bibliometric analysis[J]. Environmental Science, 2022, 43(11): 5169−5179.
[39] 汤金来, 赵宽, 胡睿鑫, 等. 滁州市表层土壤重金属含量特征、源解析及污染评价[J]. 环境科学, 2023, 44(6): 3562−3572. Tang J L, Zhao K, Hu R X, et al. Heavy metal concentration, source, and pollution assessment in topsoil of Chuzhou City[J]. Environmental Science, 2023, 44(6): 3562−3572.
-
期刊类型引用(6)
1. 卢碧翠,张修华,王智青,张红进,刘丽立,潘晓瑜,杨明生,黄中伟,陈奇志. 提高电解二氧化锰中间控制磨粉样铁含量检测效率的研究. 中国锰业. 2024(03): 60-63 .  百度学术
百度学术
2. 杨精存,丁杭冰,施亚菁. 磁性固相萃取-电感耦合等离子体质谱(ICP-MS)法同时检测制革废水多种重金属元素. 皮革与化工. 2024(05): 20-25 . 百度学术
3. 冯先进,杨斐. 电感耦合等离子体串联质谱技术特点及国内应用现状. 冶金分析. 2023(09): 1-13 . 百度学术
4. 严煜,韩乃旭,卢水淼,夏晓峰,林黎,张秀丽. 工业在线-电感耦合等离子体发射光谱法分析湿法冶炼硫酸锌溶液中铜镉钴铁. 岩矿测试. 2022(01): 153-159 . 本站查看
5. 王干珍,彭君,李力,秦毅,曹健,田宗平. 锰矿石成分分析标准物质研制. 岩矿测试. 2022(02): 314-323 . 本站查看
6. 王凯凯. 等离子质谱在水环境重金属检测中的应用. 冶金管理. 2021(11): 163-164 . 百度学术
其他类型引用(0)
-
其他相关附件


计量
- 文章访问数: 133
- HTML全文浏览量: 12
- PDF下载量: 39
- 被引次数: 6
 京公网安备 11010202008159号