
Review on Re-Os Isotope Dating Based on Literature Visualization Method
-
摘要:
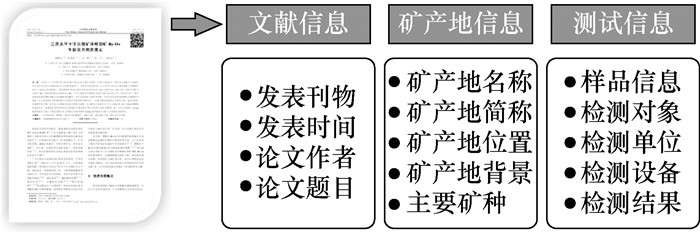
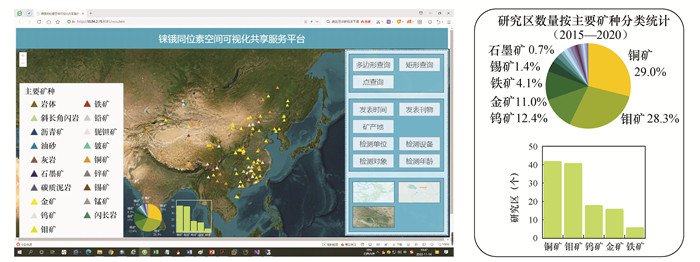
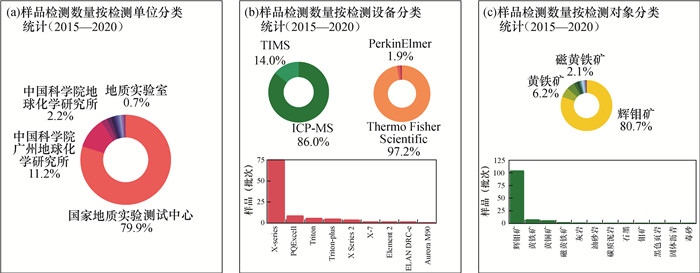
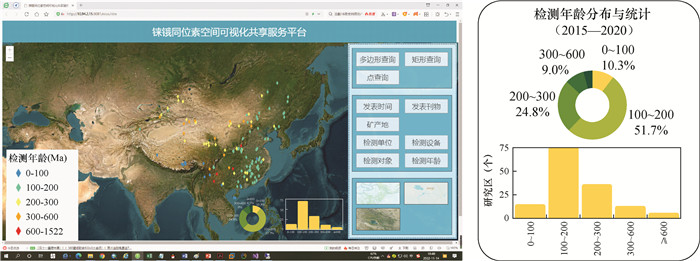
文献资料是知识传播的重要载体,具有系统性、连续性、数量大、更新快等特点,是重要的信息源,文献资料的可视化研究对知识的传播具有重要意义。当前文献资料的可视化研究多与文献计量分析方法相结合,将文献之间的关系以科学知识图谱的方式可视化地展现,这一技术方法的应用在挖掘文献数据蕴含的信息和规律上发挥了重要作用,但是在文献资料的空间属性挖掘展现上稍显不足,需要在这一领域开展深入研究。本文采用地理信息系统(GIS)技术进行了文献资料的空间可视化方法研究,形成了对文献数据进行信息挖掘和空间可视化的策略和技术路线,并以2015—2020年公开发表的Re-Os同位素定年文献数据为例,对该技术方法进行应用试验。结果表明:①研究区包含文献记载的2015—2020年期间开展Re-Os同位素定年研究工作的140多个矿产地,覆盖中国东中西部地区。②研究区主要矿种共19种,以铜(29.0%)、钼(28.3%)、钨(12.4%)、金(11.0%)为主。③检测对象共计12种,以辉钼矿作为检测对象的研究占比达80.7%,表明辉钼矿仍是Re-Os同位素定年法的首选研究对象,这与辉钼矿的高Re/Os值特性密不可分。④检测年龄落在0~200Ma较新年龄区间矿产地占比达62.1%,多分布在中国东北和东南区域,表明东部地区的Re-Os同位素年龄集中分布在中生代,这与中国东部地区存在中生代大规模成矿事件是相一致的;落在200Ma以上年龄区间矿产地占比达37.9%,多分布在中国中部和西部区域,表明中西部地区的Re-Os同位素年龄集中分布在中生代以前,且具有多期次成矿的特点。本文提出的文献资料可视化技术方法在揭示同位素定年研究的重要目标区域、关键研究矿种和主要应用技术等方面,可提供空间可视化信息,为寻找当前成矿年代学研究的热点与难点提供参考。
要点(1) GIS数据处理技术可应用于文献资料的空间信息挖掘。
(2) WebGIS技术在文献空间可视化应用研究中可发挥重要作用。
(3) 本方法可实现Re-Os同位素定年文献中矿种、技术方法、成矿年龄等信息空间可视化。
HIGHLIGHTS(1) GIS data processing technology can be applied to the spatial information mining of literature.
(2) WebGIS technology can play an important role in the application research of document spatial visualization.
(3) Spatial visualization of ore type, technical method, mineralization age and other information in Re-Os isotope dating documents can be obtained with this method.
Abstract:BACKGROUNDWith the continuous accumulation of data resources around the world, the application of data visualization has become more urgent, and the methods of data visualization have also shown diversified characteristics. Data visualization is a scientific and technical research on the visual representation of data, which studies how to display relatively obscure data visually in a real and accurate way, to vividly and intuitively express the information and rules contained in the data. Literature is an important carrier of knowledge dissemination, with systematic characteristics, continuity, a large quantity and fast update, and is an important source of information. The visualization research of literature is of great significance to the dissemination of knowledge. At present, the visualization research of document data is mostly combined with the bibliometric analysis method, which visualizes the relationship between documents in the form of a scientific knowledge map. The application of this technology and method has played an important role in mining the information and rules contained in document data, but it is slightly insufficient in the spatial attribute mining of document data, which requires in-depth research in this field.
OBJECTIVESTo provide new solutions for expanding the application of literature data in the field of spatial visualization, thereby further enhancing the usable value of literature data.
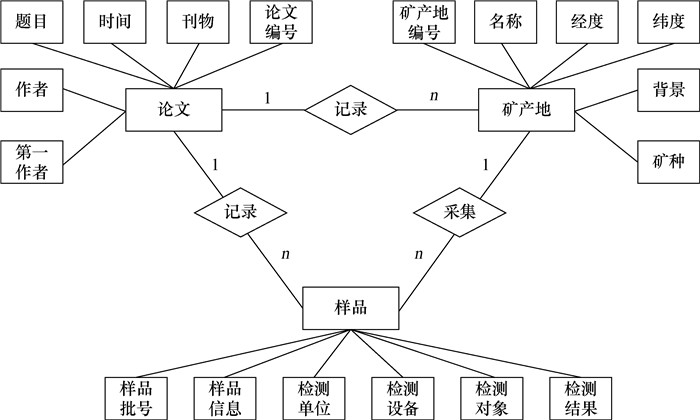
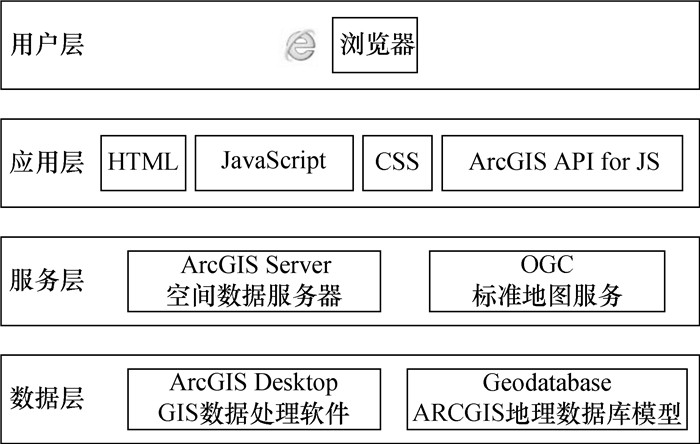
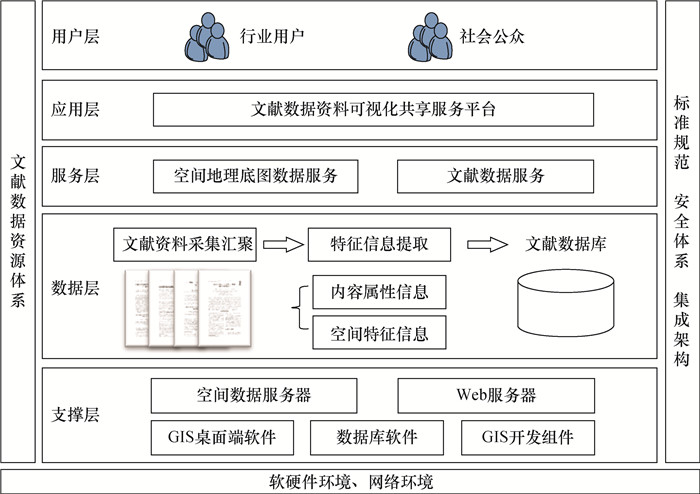
METHODSGIS technology was used to carry out the research on the spatial visualization method of document data, excavate the common content features and spatial features of document data, and gather the structured document data of a certain volume of spatial feature information to lay the data foundation for the visualization research. At the same time, the combination point between GIS technology and document data was studied, and the strategy and technical route for information mining and spatial visualization of document data were formed. Taking the data of more than 140 Re-Os isotope dating documents published since 2015 to 2020 as an example, the application test of this technical method was carried out. A Re-Os isotope data visualization service system with a five-tier architecture including layers of support, data, service, application and user has been developed, to realize the spatial visualization application of Re-Os isotope dating document data results.
RESULTSThe results show that: (1) The study area contains more than 140 ore producing areas that carried out Re-Os isotope dating research from 2015 to 2020, covering the eastern, central, and western regions of China. (2) There are 19 main minerals in the study area, mainly copper (29.0%), molybdenum (28.3%), tungsten (12.4%) and gold (11.0%). (3) There are 12 kinds of detection objects, and the proportion of molybdenite as the detection object is 80.7%, which indicates that molybdenite is still the preferred research object of the Re-Os isotope dating method, which is inseparable from the high Re/Os value of molybdenite. (4) The detection age falls in the lower age range of 0-200Ma, accounting for 62.1% of the ore-producing areas, which are mainly distributed in the northeast and southeast regions of China, indicating that the Re-Os isotope ages in the eastern region are concentrated in the Mesozoic era, which is consistent with the existence of large-scale Mesozoic mineralization events in the eastern region of China. The ore-producing area in the age range above 200Ma accounts for 37.9%, which is mainly distributed in the central and western regions of China, indicating that the Re-Os isotope ages in the central and western regions are concentrated before the Mesozoic era and have the characteristics of multiple mineralization.
CONCLUSIONSThe research shows that the document data visualization technology and method proposed in this paper can be used to excavate the spatial characteristics of the document data, expand the application of the document data in the field of spatial visualization, and solve the problems of how to analyze and extract the common information of the document data, locate the spatial feature information, and realize the spatial visualization technology. In terms of revealing important target areas, key research minerals and main application technologies, it can provide spatial visualization information, and provide reference for finding the hot spots and difficulties of current metallogenic chronology research.
-
Keywords:
- GIS /
- journal literature /
- Re-Os isotope dating /
- ore-producing area /
- visualization /
- information digging
-
城市地表沉积物是一种物质组成和来源复杂的环境介质,主要来自大气沉降、城市交通、建筑和工业等各种非点源所产生的颗粒物质,在风力、水力及重力作用下,沉积在城市不透水表面而形成[1-2]。地表沉积物已经成为城市环境污染的重要组成部分,是承载各类污染物的重要媒介[3-5]。首先它是城市大气颗粒物的主要来源[6-7],尤其是极细颗粒物极易在风力及人类活动的扰动下进入大气,携带各类污染物(重金属、多环芳烃等)通过皮肤干沉降、呼吸系统进入人体,严重威胁城市居民的身体健康[8-10]。其次它是城市水体环境污染的重要因素[11-12],通过降雨、城市道路洒水等外力作用下进入城市水体环境系统,将沉积物所携带的各类污染物带入水体、土壤、动植物体内,产生潜在的生态污染效应。因此,研究城市地表沉积物中各类污染物的分布情况及影响因素对制定控制污染措施具有重要意义。
近年来国内外众多学者从不同角度对城市地表沉积物展开了大量研究,主要涉及各类污染物的来源解析、含量特征、富集水平、空间分布特征以及健康风险评价等[13-20]。Klees等[21]研究了德国威斯特伐利亚街道灰尘中多氯联苯等有机污染物,认为多氯联苯等有机污染物浓度随样品粒径的减小而增大,主要来自工业污染。Škrbić等[22]在夏冬两季对塞尔维亚诺维萨德市街道灰尘中多环芳烃进行了研究,汽车尾气的放排是街道灰尘中多环芳烃的主要来源,对儿童的致癌风险更高。对于城市灰尘污染的相关研究,我国起步较晚,直到20世纪90年代初,在“成都市街道地表物中的重金属”一文中首次出现了关于地表灰尘的研究[23]。近年,随着人们对城市环境污染认识的提高,逐渐意识到地表灰尘的危害。Li等[24]研究了城市不同功能区的重金属污染程度,认为街道灰尘中重金属浓度高于当地土壤背景值,对当地居民健康有较大的危害。杨忠平等[25]对长春市城区近地表灰尘重金属健康风险进行了评价,结果表明重金属含量显著高于研究区表层土壤,已经受到一定程度的重金属污染,并对儿童造成了潜在健康风险。叶友斌等[26]对北京城市道路积尘多环芳烃的粒度分布特征进行了研究,得出高比例的细颗粒及细颗粒中的多环芳烃使得道路积尘再悬浮进入大气以及随湿沉降进入地表径流的环境风险加大。田晖等[27]对西安市地表灰尘中Cd、Cr、Pb赋存形态的研究表明,Cr主要结合在残渣态中,其次以有机物结合态和铁锰氧化物结合态存在;Pb主要以残渣态和铁锰氧化物结合态存在,少部分以有机物结合态存在;Cd依次主要以有机物结合态、残渣态和铁锰氧化物结合态存在。目前多数研究是对各类污染物分布特征进行单一描述并采用美国环境保护部推荐的健康风险评价模型进行评价,而对影响各类污染物分布特征综合因素的研究较少。
本文以成都市中心城区为研究区域,采集地表沉积物样品,采用激光粒度分析仪、电感耦合等离子体质谱[28-29]、电感耦合等离子体发射光谱[30]、原子荧光光谱、X射线衍射、扫描电镜能谱等技术手段分析研究了地表沉积物中粒径分布特征、重金属元素分布特征、矿物组成特征及微区形貌特征。通过对成都市中心城区地表沉积物的物化及矿物学特征研究,了解了成都市中心城区地表沉积物重金属在不同区域的分布特征及污染程度,查明了影响重金属分布特征和污染程度的主要因素,为研究制定城市地表沉积物环境质量标准奠定基础。
1. 实验部分
1.1 样品采集
在实际调研的基础上,在成都市中心成区共设置了40个地表沉积物采样点,其中东南西北四个方位的一环路内、一环路和二环路之间、二环路和三环路之间、三环路外共设置16个道路沉积物采样点和16个生活小区沉积物采样点,道路和生活小区采样点尽量靠近,计32个样品;同时设置两个特殊采样区域,工业园区和餐饮区,每个特殊区域采集4个样品,计8个样品。总计采集地表沉积物样品40个。在天气晴好的条件下,至少连续一周,采用飞利浦真空吸尘器进行采集3~5处地表沉积物样品,组成一个混合样品,每个样品质量约100g。
1.2 分析方法
地表沉积物的实验测试主要包括粒度分析、重金属含量分析、矿物组成特征和形貌特征等,均由国土资源部西南矿产资源监督检测中心承担。
1.2.1 沉积物样品预处理
沉积物样品自然风干,除去杂草、小石块、烟头等杂物后,放入聚乙烯塑料袋中密封保存。
1.2.2 粒度分析
不同粒径级别沉积物样品质量分布采用振动筛分仪(型号AS200,德国莱驰公司)进行分筛,尺寸分别为:1~0.45mm、0.45~0.3mm、0.3~0.125mm、0.125~0.075mm、≤0.075mm,相应质量使用精度为0.1mg的分析天平进行称重。
不同粒径级别沉积物样品体积分布采用激光粒度分析仪(型号:S3500,美国麦克奇公司)进行分析。
1.2.3 重金属含量分析
As和Hg采用50%的王水水浴提取,原子荧光光谱仪(型号AFS-230E,北京海光仪器公司)测定;Cr、Ni、Cu、Zn、Cd、Pb、K、Na等元素采用四酸(盐酸、硝酸、氢氟酸、高氯酸)分解,电感耦合等离子体质谱仪(型号iCAP Q,美国ThermoFisher公司)和电感耦合等离子体发射光谱仪(型号iCAP6300,美国ThermoFisher公司)测定。
1.2.4 矿物组成分析
选取部分不同粒径级别的沉积物制成粒径为75mm样品,采用X射线衍射分析仪(型号X’pert pro MPD,荷兰帕纳科公司)对不同粒径级别的沉积物进行矿物成分分析。
1.2.5 微区形貌特征分析
选取预处理后的沉积物样品,采用扫描电镜能谱仪(型号S-4800,日本日立公司)对沉积物进行能谱和形貌特征分析。
2. 结果与讨论
2.1 地表沉积物粒径分布特征
粒径分布是指某一粒子群中不同粒子所占的比例,地表沉积物的粒径大小在一定程度上决定了沉积物的可移动性和潜在的污染效应[31]。表 1为40个样点不同粒径级别沉积物样品质量分布。从中可以看出,不同粒径级别沉积物的质量比存在一定的差异,0.3~0.125mm、0.125~0.075mm和≤0.075mm三个范围粒径的沉积物质量大致相当,占总质量的70%以上,小于0.125mm粒径的沉积物质量占总质量的40%左右,小于0.075mm粒径的沉积物质量占总质量的20%左右,说明地表沉积物主要以中细颗粒物为主。图 1为1个不同粒径级别沉积物样品体积分布图。从图中可以看出,沉积物粒径体积分布曲线呈非正态多峰分布,这是由城市地表沉积物来源的复杂性及其高度变化时空分布特征所决定的。小于50.38μm粒径的沉积物体积占总体积的25%,小于145.1μm粒径的沉积物体积占总体积的50%,小于357.4μm粒径的沉积物体积占总体积的75%,与不同粒径级别沉积物样品质量分布一致,都是以中细颗粒物为主。
表 1 不同粒径级别沉积物样品质量分布Table 1. Weight distribution of surface sediments with different particle sizes采样方位 采样区域 不同粒径级别沉积物样品质量比(%) 1~0.45mm 0.45~0.3mm 0.3~0.125mm 0.125~0.075mm ≤0.075mm 东向 一环路内道路 10.86 21.28 28.65 21.56 14.69 一环路内小区 6.97 17.87 23.62 21.77 27.06 一环~二环内道路 14.04 23.53 26.84 18.28 14.95 一环~二环内小区 19.57 24.47 22.54 16.26 13.03 二环~三环内道路 7.75 14.48 22.66 27.35 25.62 二环~三环内小区 2.17 7.05 17.42 28.25 44.55 三环外道路 19.73 24.82 19.06 13.77 16.37 三环外小区 7.08 15.99 25.50 23.72 25.59 平均值 11.02 18.69 23.29 21.37 22.73 南向 一环路内道路 11.32 21.71 26.32 19.90 15.83 一环路内小区 4.33 7.19 13.64 22.03 49.79 一环~二环内道路 12.24 25.56 23.39 20.72 13.64 一环~二环内小区 7.06 13.16 22.12 27.17 26.20 二环~三环内道路 23.75 26.90 18.38 12.78 12.33 二环~三环内小区 16.69 15.70 14.24 18.81 20.32 三环外道路 11.28 21.87 25.19 20.02 18.34 三环外小区 12.65 23.33 23.45 20.75 15.21 平均值 11.68 19.04 22.13 20.85 22.13 西向 一环路内道路 16.39 23.39 24.62 19.60 10.15 一环路内小区 12.37 27.51 26.05 17.63 12.90 一环~二环内道路 14.27 23.94 26.06 21.45 11.24 一环~二环内小区 27.67 25.78 15.73 12.65 10.97 二环~三环内道路 13.65 26.13 22.15 19.37 14.87 二环~三环内小区 9.35 14.35 19.22 21.14 27.10 三环外道路 5.07 19.36 25.94 23.19 21.24 三环外小区 11.12 27.90 23.39 17.93 18.83 平均值 12.31 20.42 22.37 20.32 20.22 北向 一环路内道路 17.64 29.08 24.83 14.23 9.85 一环路内小区 7.47 23.58 20.52 17.32 26.87 一环~二环内道路 14.32 26.59 26.83 19.45 11.21 一环~二环内小区 3.03 18.40 20.62 20.72 34.75 二环~三环内道路 13.15 25.30 24.12 20.86 14.72 二环~三环内小区 8.70 11.11 17.79 28.50 25.02 三环外道路 6.18 17.20 21.17 22.47 22.27 三环外小区 16.69 22.11 23.50 17.19 15.42 平均值 11.99 20.71 22.38 20.27 20.17 工业区 道路 5.87 21.76 23.89 25.11 15.96 道路 21.86 29.07 22.26 15.01 8.29 道路 16.50 20.17 20.48 19.47 14.87 道路 16.42 20.33 21.96 21.30 11.35 平均值 12.30 20.92 22.36 20.26 19.42 餐饮区 道路 17.25 25.76 20.61 16.82 16.25 道路 14.18 19.61 17.90 18.54 26.70 道路 9.91 13.55 15.53 18.66 39.63 道路 13.82 22.07 20.83 19.94 19.13 平均值 12.44 20.86 22.03 20.11 19.95 ![]() 图 1 不同粒径级别地表沉积物样品体积分布图Figure 1. Volume distribution of surface sediments with different particle sizes
图 1 不同粒径级别地表沉积物样品体积分布图Figure 1. Volume distribution of surface sediments with different particle sizes本文对地表沉积物粒径的质量和体积分布特征,所得结论与前人研究结果[32-33]一致。
2.2 地表沉积物中重金属元素分布特征
2.2.1 重金属元素在不同沉积物粒径级别中的分布特征
将Cu、Pb、Zn、As、Hg、Cr、Cd、Ni等8种重金属元素和Ca、K、Na等3种造岩元素在不同沉积物粒径级别中的含量绘制成箱线图,如图 2和图 3所示。从图中可以看出Cu、Pb、Zn、As、Hg、Cr、Cd、Ni等重金属含量随着沉积物粒径的减小而呈现明显增加的趋势,主要存在于粒径小于0.125mm的沉积物中。而Ca、K、Na等造岩元素含量随着沉积物粒径的减小而无明显变化。因此重金属在地表沉积物中的分布特征体现了粒级效应,即粒径越细,重金属含量越高,与前人研究结论[32-33]相似。而Ca、K、Na等造岩元素在不同粒径级别沉积物中含量基本一致,其组成岩石矿物的结构可能对重金属的吸附有一定的影响。
![]() 图 2 重金属在不同粒径级别地表沉积物中含量比例分布箱式图Figure 2. Box plots illustrating the results of heavy metals in surface sediment with different particle sizes
图 2 重金属在不同粒径级别地表沉积物中含量比例分布箱式图Figure 2. Box plots illustrating the results of heavy metals in surface sediment with different particle sizes![]() 图 3 造岩元素在不同粒径级别地表沉积物中含量比例分布箱式图Figure 3. Box plots illustrating the results of rock forming elements in surface sediments with different particle sizes
图 3 造岩元素在不同粒径级别地表沉积物中含量比例分布箱式图Figure 3. Box plots illustrating the results of rock forming elements in surface sediments with different particle sizes2.2.2 重金属元素在研究区的区域分布特征
表 2显示了地表沉积物中重金属和造岩元素在不同方位区域内的含量。Ca、K、Na等造岩元素在各个区域内含量差异不大。Cu、Pb、Zn、As、Hg、Cr、Cd、Ni平均含量在成都市各方位区域上分布顺序为Cu:西向>南向>工业区>北向>东向>餐饮区;Pb:南向>北向>西向>工业区>东向>餐饮区;Zn:南向>工业区>西向>北向>东向>餐饮区;As:北向>南向>工业区>东向>西向>餐饮区;Hg:南向>餐饮区>北向>西向>东向>工业区;Cr:工业区>西向>南向>北向>东向>餐饮区;Cd:南向>工业区>西向>东向>北向>餐饮区;Ni:工业区>西向>南向>北向>东向>餐饮区。
表 2 地表沉积物中重金属空间分布Table 2. Spatial distribution of heavy metals in surface sediments采样方位 采样位置 Ca
(%)K
(%)Na
(%)Cu
(μg/g)Pb
(μg/g)Zn
(μg/g)As
(μg/g)Hg
(μg/g)Cr(μg/g) Cd
(μg/g)Ni
(μg/g)东向 一环内 5.20 1.40 1.54 90.21 59.95 399.28 5.67 0.42 207.57 1.26 38.17 一环~二环 3.84 1.41 1.30 84.98 75.69 337.00 6.86 0.11 97.95 1.21 28.28 二环~三环 4.47 1.50 1.73 41.43 43.07 182.03 4.87 0.03 82.75 0.49 19.92 三环外 4.61 1.58 1.86 26.32 24.36 167.25 4.80 0.04 77.79 0.27 19.69 南向 一环内 4.62 1.44 1.60 133.13 73.65 351.29 6.11 0.88 129.16 1.01 28.49 一环~二环 4.27 1.38 1.29 144.88 56.27 327.02 4.71 0.59 101.70 0.93 30.68 二环~三环 5.01 1.41 1.61 126.17 380.22 380.32 7.64 0.28 184.22 1.89 27.78 三环外 6.01 1.45 1.71 128.94 122.94 396.58 4.97 0.21 162.49 1.22 31.29 西向 一环内 5.20 1.40 1.54 90.21 59.95 399.28 5.67 0.42 207.57 1.26 38.17 一环~二环 4.54 1.41 1.74 164.33 51.03 292.61 4.36 0.07 140.19 0.58 23.05 二环~三环 4.83 1.45 1.75 203.66 73.54 293.87 5.15 0.07 212.43 0.54 51.78 三环外 4.70 1.46 2.25 76.23 54.72 250.41 5.14 0.09 101.47 0.64 33.68 北向 一环内 4.62 1.44 1.60 133.13 73.65 351.29 6.11 0.89 129.16 1.01 28.49 一环~二环 5.17 1.57 2.26 76.39 224.40 266.41 4.76 0.06 127.63 0.42 24.18 二环~三环 4.56 1.66 2.05 59.11 53.24 298.20 9.89 0.10 101.92 0.47 25.38 三环外 5.19 1.52 1.94 57.82 49.08 215.92 5.47 0.06 148.87 0.55 31.62 工业区 4.73 1.60 1.84 86.53 57.37 386.14 5.22 0.06 173.65 1.14 39.16 餐饮区 5.42 1.48 1.69 55.27 39.66 197.45 4.30 0.39 92.52 0.62 24.16 综合以上比较,在成都市各方位区域中,Cu、Zn、Pb、Cr含量差异较大,而As、Hg、Cd、Ni含量差异不大。Cu、Zn、Pb、Cr在成都市西向、南向和工业区相对较高,工业区集中了大量的电子科技类产业,而西向和南向是成都市繁华的商业区和居民区,各类商店聚集,人员流动大,车流缓慢,这些重金属主要来源于人类活动,与成都市的经济发展区域结构特征相吻合。
Cu、Pb、Zn、As、Hg、Cr、Cd、Ni等重金属平均含量在成都市各环路区域上分布具有一定的差异,西向和南向各重金属在不同环路区域内的平均含量差异不大,而东向和北向各重金属在不同环路区域内的平均含量差异较大,由一环内向外逐渐降低。说明成都市西向和南向地表沉积物中重金属整体污染程度较高,而东向和北向地表沉积物中重金属污染主要集中在二环路之内。
通过以上分析表明,城市地表沉积物重金属污染程度与人类活动情况息息相关,高速发展的经济促进了人类社会和城市的发展,但同时也带来了城市生态环境的污染。
2.3 地表沉积物矿物组成的分布特征
地表沉积物矿物组成影响着沉积物粒径和重金属元素分布特征,采用X射线衍射分析仪对不同粒径级别的沉积物进行矿物成分分析。从表 3分析结果可以看出:石英、长石类、方解石等矿物在不同粒径级别沉积物中所占含量大致相当,与2.2.1节所述Ca、K、Na等造岩元素含量随着沉积物粒径的减小而无明显变化结论一致。这些矿物机械性较强,一般很难破损至很细粒径,但在各粒径级别沉积物中的含量大致相当,说明在搬运过程中这些矿物有的已经达到很细粒径,二次挤压、磨圆的作用不大。而细粒径矿物常具有许多原生矿物所没有的特性,如长石类矿物主要是铝硅酸盐,具有层状结构,细粒径矿物表现出胶体行为,大部分重金属都极易与其发生作用。因此大部分人类活动产生的重金属多存在于细颗粒沉积物中,与2.2.1节结论相吻合。
表 3 不同粒径级别地表沉积物的矿物组成Table 3. Mineral composition of surface sediment with different particle sizes样品编号 粒径
(mm)石英
(%)钠长石
(%)微斜长石
(%)方解石
(%)白云母
(%)十字沸石
(%)镁铝蛇纹石(%) 1 1~0.45 36.9 33.0 11.5 16.3 1.1 - - 0.45~0.3 47.1 29.8 13.5 3.0 1.2 3.8 - 0.3~0.125 52.6 24.3 15.4 2.5 4.3 - - 0.125~0.075 43.3 32.5 14.2 3.8 2.4 - - ≤0.075 51.8 26.8 9.1 7.3 3.9 - 1.0 2 1~0.45 44.4 29.7 9.7 8.9 4.7 - - 0.45~0.3 42.0 25.4 13.1 7.0 4.3 8.1 - 0.3~0.125 48.7 30.0 12.6 6.8 - - - 0.125~0.075 53.8 25.0 9.2 7.8 4.1 - - ≤0.075 42.2 26.1 13.0 13.1 4.0 - - 注:表中“-”表示未检出该矿物。 2.4 地表沉积物的微区形貌特征
地表沉积物微区形貌特征研究可以更加直观、无损地了解沉积物粒径分布特征,辅以能谱分析可以从微区原位角度了解沉积物的重金属元素分布特征。图 4为不同放大倍数的背散射电子成像图,通过图上比例尺可以直观地发现,大部分沉积物颗粒很小,介于50~500μm,其中大粒径沉积物棱角分明,中细粒径沉积物多成光滑圆形、椭圆形或方形。
![]() 图 4 地表沉积物扫描电镜背散射电子图像a和b—沉积物样品在不同位置放大30倍的背散射电子图像;c和d—沉积物样品在不同位置放大80倍的背散射电子图像。Figure 4. Backscattered electron images of surface sediments measured by scanning electron microscopy
图 4 地表沉积物扫描电镜背散射电子图像a和b—沉积物样品在不同位置放大30倍的背散射电子图像;c和d—沉积物样品在不同位置放大80倍的背散射电子图像。Figure 4. Backscattered electron images of surface sediments measured by scanning electron microscopy图 5为不同粒径级别的沉积物颗粒能谱图,发现Si、Ca、K、Na等造岩元素在不同粒径级别沉积物中都大量存在, 大部分微量重金属主要存在于中细粒径沉积物中。
![]() 图 5 地表沉积物扫描电镜-能谱图Figure 5. Scanning electron microscopy-energy spectra of surface sediments
图 5 地表沉积物扫描电镜-能谱图Figure 5. Scanning electron microscopy-energy spectra of surface sediments3. 结论
利用多种技术手段分析研究了成都市中心城区地表沉积物的物化及矿物学特征,并探讨了影响重金属分布特征的主要因素。研究表明成都市中心城区地表沉积物粒径质量分布、体积分布和形貌观察分布具有高度一致性,主要以中细颗粒为主;不同粒径级别地表沉积物重金属化学成分分析和微区原位能谱分析结果类似,重金属主要分布在中细粒径级别的沉积物中,体现了重金属元素分布的粒级效应;不同粒径级别地表沉积物矿物组成均含有石英、长石类、方解石等矿物,这些矿物所具有的结构特征在细粒径沉积物中表现出胶体行为,极易吸附微量重金属元素,是重金属元素分布体现粒级效应的内在决定因素;在成都市中心城区不同方位区域和环路区域,重金属元素分布具有一定的差异,Cu、Zn、Pb、Cr在成都市西向、南向和工业区相对较高,Cu、Pb、Zn、As、Hg、Cr、Cd、Ni在二环路之内相对较高,体现重金属元素空间分布的区域效应,主要受城市人类活动的影响。
本研究成果可为城市生态环境的综合治理提供理论支撑,同时可为研究制定城市地表沉积物环境质量标准奠定基础。当前,城市地表沉积物的污染程度缺乏评价标准,多数学者采用与城市土壤基体进行比较评价,与城市土壤成分相对稳定的性质不同,城市地表沉积物组成和来源复杂,迁移性强,因此急需研究制定城市地表沉积物环境质量标准,也是此领域研究的重要方向。
-
![]()
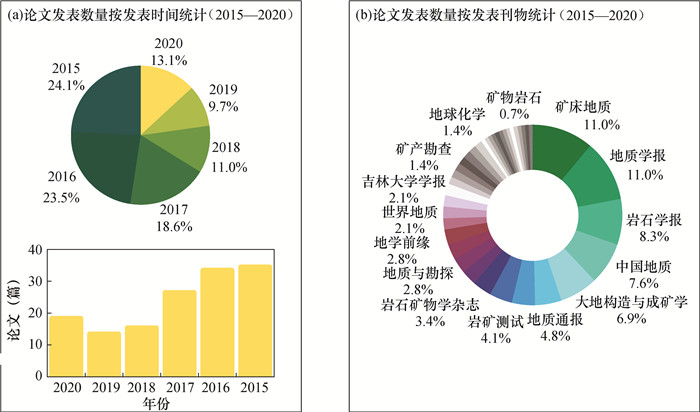
图 5 (a) 论文发表数量按发表时间统计(2015—2020);(b)论文发表数量按发表刊物统计(2015—2020)
Figure 5. (a) Numbers of published papers counted according to the time of publication (2015—2020); (b) Numbers of published papers counted according to the published journals (2015—2020).
![]()
图 7 (a) 样品检测数量按检测单位统计(2015—2020);(b)样品检测数量按检测设备统计(2015—2020);(c)样品检测数量按检测对象统计(2015—2020)
Figure 7. (a) Numbers of tested samples according to the laboratories (2015—2020); (b) Numbers of tested samples according to the analytical instruments (2015—2020); (c) Numbers of tested samples according to the detected objects (2015—2020).
表 1 文献数据空间可视化共享服务平台核心功能
Table 1 Basic function of literature data visualized share and service system.
平台核心功能点 功能描述 文献数据展示 文献数据空间可视化展示 地理底图服务展示 地理底图服务空间可视化展示 图例展示 当前加载空间数据服务所对应图例的可视化展示 空间查询 对当前加载空间数据服务的点查询、多边形查询、矩形查询  下载: 导出CSV
表 2 查询功能及核心接口说明
Table 2 Specification of search function and basic API.
查询功能 功能说明 核心接口 核心接口使用说明 点查询 在地图上选择要查询的点要素,以表格的形式展示当前所选要素的属性信息 esri/layers/MapImageLayer 对该接口的popupTemplate属性的定义来完成对点查询结果弹窗的内容赋值 多边形查询 在地图上绘制多边形查询范围,以表格的形式展示查询范围内所有要素的属性信息 esri/widgets/Sketch 通过该接口的layer属性定义图形绘制图层;通过view属性定义绘制的地图窗口。通过该接口的create方法激活绘图工具,绘制多边形。 esri/tasks/support/Query 通过该接口的outFields属性来获取图层的字段信息 矩形查询 在地图上绘制矩形查询范围,以表格的形式展示查询范围内所有要素的属性信息 esri/widgets/Sketch 通过该接口的layer属性定义图形绘制图层;通过view属性定义绘制的地图窗口。通过该接口的create方法激活绘图工具,绘制矩形。 esri/tasks/support/Query 通过该接口的outFields属性获取图层的字段信息
下载: 导出CSV
-
[1] 陈为, 沈则潜, 陶煜波, 等. 数据可视化[M]. 北京: 电子工业出版社, 2019: 2-46. Chen W, Shen Z Q, Tao Y B, et al. Data visualization[M]. Beijing: Publishing House of Electronics Industry, 2019: 2-46.
[2] 胡泽文, 王效岳, 白如江. 国内外文本分类研究计量分析与综述[J]. 图书情报工作, 2011, 55(6): 78-81, 142. https://www.cnki.com.cn/Article/CJFDTOTAL-TSQB201106021.htm Hu Z W, Wang X Y, Bai R J. Quantitative analysis and review of text classification research at home and abroad[J]. Library and Information Service, 2011, 55(6): 78-81, 142. https://www.cnki.com.cn/Article/CJFDTOTAL-TSQB201106021.htm
[3] 肖明, 邱小花, 黄界, 等. 知识图谱工具比较研究[J]. 图书馆杂志, 2013, 32(3): 61-69. doi: 10.3969/j.issn.1671-3982.2013.03.017 Xiao M, Qiu X H, Huang J, et al. Comparison of software tools for mapping knowledge domain[J]. Library Journal, 2013, 32(3): 61-69. doi: 10.3969/j.issn.1671-3982.2013.03.017
[4] 梁秀娟. 科学知识图谱研究综述[J]. 图书馆杂志, 2009, 28(6): 58-62. https://www.cnki.com.cn/Article/CJFDTOTAL-TNGZ200906016.htm Liang X J. Review of mapping knowledge domains[J]. Library Journal, 2009, 28(6): 58-62. https://www.cnki.com.cn/Article/CJFDTOTAL-TNGZ200906016.htm
[5] 郭宇, 王晰巍, 贺伟, 等. 基于文献计量和知识图谱可视化方法的国内外低碳技术发展动态研究[J]. 情报科学, 2015, 33(4): 139-148. doi: 10.13833/j.cnki.is.2015.04.027 Guo Y, Wang X W, He W, et al. Chinese and international dynamic research into low carbon technology based on bibliometrics and knowledge mapping[J]. Information Science, 2015, 33(4): 139-148. doi: 10.13833/j.cnki.is.2015.04.027
[6] 刘娟, 唐加福. 基于文献计量和可视化图谱的营商环境研究述评与展望[J]. 管理评论, 2022, 34(5): 318-331. doi: 10.14120/j.cnki.cn11-5057/f.2022.05.005 Liu J, Tang J F. Review and prospect of doing-business environment research based on bibliometric and visualization map[J]. Management Review, 2022, 34(5): 318-331. doi: 10.14120/j.cnki.cn11-5057/f.2022.05.005
[7] 陈致明, 赵湘, 康广, 等. GIS技术发展综述[J]. 河北科技大学学报, 2001, 22(3): 6-9, 51. Chen Z M, Zhao X, Kang G, et al. Summary of the technique development of GIS[J]. Journal of Hebei University of Science and Technology, 2001, 22(3): 6-9, 51.
[8] 周九常, 刘智明. 数据挖掘研究综述[J]. 河南图书馆学刊, 2018, 38(8): 130-137. https://www.cnki.com.cn/Article/CJFDTOTAL-HNTX201808054.htm Zhou J C, Liu Z M. Survey of data mining research[J]. The Library Journal of Henan, 2018, 38(8): 130-137. https://www.cnki.com.cn/Article/CJFDTOTAL-HNTX201808054.htm
[9] 杜安道, 屈文俊, 李超, 等. 铼-锇同位素定年方法及分析测试技术的进展[J]. 岩矿测试, 2009, 28(3): 288-304. doi: 10.3969/j.issn.0254-5357.2009.03.019 Du A D, Qu W J, Li C, et al. A review on the development of Re-Os isotopic dating methods and techniques[J]. Rock and Mineral Analysis, 2009, 28(3): 288-304. doi: 10.3969/j.issn.0254-5357.2009.03.019
[10] 化柏林. 数据挖掘与知识发现关系探析[J]. 情报科学, 2008, 31(4): 507-510. doi: 10.3969/j.issn.1007-7634.2008.04.007 Hua B L. Analysis of the relationship between data mining and knowledge discovery[J]. Information Science, 2008, 31(4): 507-510. doi: 10.3969/j.issn.1007-7634.2008.04.007
[11] 谌志群, 张国煊. 文本挖掘与中文文本挖掘模型研究[J]. 情报科学, 2007, 25(7): 1046-1051. doi: 10.3969/j.issn.1007-7634.2007.07.020 Shen Z Q, Zhang G X. Study on the text mining and Chinese text mining framework[J]. Information Science, 2007, 25(7): 1046-1051. doi: 10.3969/j.issn.1007-7634.2007.07.020
[12] 潘梅森, 颜君彪. UML在数据库建模中的应用[J]. 现代计算机(专业版), 2005(7): 25-28. Pan M S, Yan J B. On the application of UML in the database moldeling[J]. Modern Computer (Professional Edition), 2005(7): 25-28.
[13] 杨中书, 刘臣宇. 基于E-R模型的关系数据库设计方法[J]. 价值工程, 2014, 33(30): 242-243. https://www.cnki.com.cn/Article/CJFDTOTAL-JZGC201430137.htm Yang Z S, Liu C Y. Design method of relation database based on E-R model[J]. Value Engineering, 2014, 33(30): 242-243. https://www.cnki.com.cn/Article/CJFDTOTAL-JZGC201430137.htm
[14] 彭晶晶, 罗代洪, 林锴, 等. 基于文献资源的Re-Os同位素定年数据库建设研究[J]. 岩矿测试, 2021, 40(3): 425-434. doi: 10.15898/j.cnki.11-2131/td.202104020048 Peng J J, Luo D H, Lin K, et al. Study on the construction of journal publication-based Re-Os dating database[J]. Rock and Mineral Analysis, 2021, 40(3): 425-434. doi: 10.15898/j.cnki.11-2131/td.202104020048
[15] 黄亮, 谭娟, 朱欣焰, 等. 一种空间数据服务虚拟化描述方法[J]. 计算机应用研究, 2013, 30(11): 3358-3361. https://www.cnki.com.cn/Article/CJFDTOTAL-JSYJ201311040.htm Huang L, Tan J, Zhu X Y, et al. Description method of spatial data services virtualization[J]. Application Research of Computers, 2013, 30(11): 3358-3361. https://www.cnki.com.cn/Article/CJFDTOTAL-JSYJ201311040.htm
[16] 丁立国, 周斌, 熊伟. 基于Html5的Web Map矢量渲染技术研究[J]. 测绘工程, 2017, 26(8): 62-67. https://www.cnki.com.cn/Article/CJFDTOTAL-CHGC201708013.htm Ding L G, Zhou B, Xiong W. Research on vector data rendering of web map by using Html5[J]. Engineering Of Surveying and Mapping, 2017, 26(8): 62-67. https://www.cnki.com.cn/Article/CJFDTOTAL-CHGC201708013.htm
[17] 刘杰, 魏娟. 矢量地图渲染技术研究[J]. 地理空间信息, 2021, 19(11): 128-130, 9. https://www.cnki.com.cn/Article/CJFDTOTAL-DXKJ202111033.htm Liu J, Wei J. Research on vector map rendering technology[J]. Geospatial Information, 2021, 19(11): 128-130, 9. https://www.cnki.com.cn/Article/CJFDTOTAL-DXKJ202111033.htm
[18] 吴功和, 丛明日. 基于ArcGIS Server的分布式GIS应用[J]. 测绘科学技术学报, 2006, 23(1): 52-55. https://www.cnki.com.cn/Article/CJFDTOTAL-JFJC200601015.htm Wu G H, Cong M R. Analysis of distributed GIS application based on ArcGIS Server[J]. Journal of Geomatics Science and Technology, 2006, 23(1): 52-55. https://www.cnki.com.cn/Article/CJFDTOTAL-JFJC200601015.htm
[19] 高勇, 蔡先华, 刘勖, 等. 基于ArcGIS Server的WebGIS系统开发[J]. 网络安全技术与应用, 2007(12): 68-69, 40. https://www.cnki.com.cn/Article/CJFDTOTAL-WLAQ200712033.htm Gao Y, Cai X H, Liu X, et al. Development of WebGIS system based on ArcGIS Server[J]. Network Security Technology & Application, 2007(12): 68-69, 40. https://www.cnki.com.cn/Article/CJFDTOTAL-WLAQ200712033.htm
[20] 过志峰, 王宇翔, 杨崇俊. 空间数据索引与查询技术研究及其应用[J]. 计算机工程与应用, 2002(23): 176-178, 205. https://www.cnki.com.cn/Article/CJFDTOTAL-JSGG200223058.htm Guo Z F, Wang Y X, Yang C J. Research on index and query for spatial data and GIS application[J]. Computer Engineering and Applications, 2002(23): 176-178, 205. https://www.cnki.com.cn/Article/CJFDTOTAL-JSGG200223058.htm
[21] 向忠金, 闫全人, 夏磊, 等. 滇东南八布杨万铜矿床硫化物Re-Os同位素年龄及其地质意义[J]. 岩石矿物学杂志, 2020, 39(5): 583-595. https://www.cnki.com.cn/Article/CJFDTOTAL-YSKW202005006.htm Xiang Z J, Yan Q R, Xia L, et al. Re-Os geochronology of the Babu copper deposit in southeast Yunnan Province and its geological implications[J]. Acta Petrologica et Mineralogica, 2020, 39(5): 583-595. https://www.cnki.com.cn/Article/CJFDTOTAL-YSKW202005006.htm
[22] 康欢, 刘翼飞, 江思宏. 内蒙古莲花山铜矿床辉钼矿铼-锇年代学、矿石硫-铅同位素地球化学与矿床成因[J]. 地质学报, 2019, 93(12): 3082-3094. https://www.cnki.com.cn/Article/CJFDTOTAL-DZXE201912005.htm Kang H, Liu Y F, Jiang S H. Molybdenite Re-Os dating and ore S-Pb isotopes of the Lianhuashan Cu deposit, Innner Mongolia, and their genetic significance[J]. Acta Geologica Sinica, 2019, 93(12): 3082-3094. https://www.cnki.com.cn/Article/CJFDTOTAL-DZXE201912005.htm
[23] 郑文宝, 丁帅, 李盛俊, 等. 西藏冈底斯北带首例主碰撞造山期铜矿——林周县程巴矽卡岩型铜矿床地质特征、辉钼矿Re-Os同位素年龄及成矿意义[J]. 地质学报, 2019, 93(2): 459-469. https://www.cnki.com.cn/Article/CJFDTOTAL-DZXE201902012.htm Zheng W B, Ding S, Li S J, et al. The first Cu deposit of main collisional stage on the northern Gangdese Belt: Geological features and molybdenite Re-Os dating of the Chengba skarn Cu deposit in Linzhou County and their geological significance[J]. Acta Geologica Sinica, 2019, 93(2): 459-469. https://www.cnki.com.cn/Article/CJFDTOTAL-DZXE201902012.htm
[24] 刘武生, 赵鸿, 赵如意, 等. 炭质泥岩Re-Os和碎屑锆石U-Pb同位素定年对广东大宝山铜矿床成矿时代的约束[J]. 岩矿测试, 2022, 41(2): 300-313. doi: 10.15898/j.cnki.11-2131/td.202107270085 Liu W S, Zhao H, Zhao R Y, et al. The constraints of carbonaceous mudstone Re-Os and detrital zircons U-Pb isotopic dating on the diagenetic and metallogenic ages from the dabaoshan copper deposit in Guangdong Province[J]. Rock and Mineral Analysis, 2022, 41(2): 300-313. doi: 10.15898/j.cnki.11-2131/td.202107270085
[25] 杜芷葳, 叶会寿, 毛景文, 等. 陕西西沟钼矿床辉钼矿Re-Os年代学和同位素地球化学特征及其地质意义[J]. 矿床地质, 2020, 39(4): 728-744. https://www.cnki.com.cn/Article/CJFDTOTAL-KCDZ202004012.htm Du Z W, Ye H S, Mao J W, et al. Molybdenite Re-Os geochronology and isotope geochemical characteristics of Xigou molybdenum deposit in Shaanxi Province and its geological significance[J]. Mineral Deposits, 2020, 39(4): 728-744. https://www.cnki.com.cn/Article/CJFDTOTAL-KCDZ202004012.htm
[26] 张元厚, 刘金伟, 文斌, 等. 小秦岭地区大湖—秦南钼矿床矿化类型、Re-Os定年及找矿方向[J]. 吉林大学学报(地球科学版), 2020, 50(3): 815-824. https://www.cnki.com.cn/Article/CJFDTOTAL-CCDZ202003011.htm Zhang Y H, Liu J W, Wen B, et al. Mineralization types, Re-Os dating of Dahu—Qinnan molybdenum deposit and exploration in Xiaoqinling Mt, central China[J]. Journal of Jilin University(Earth Science Edition), 2020, 50(3): 815-824. https://www.cnki.com.cn/Article/CJFDTOTAL-CCDZ202003011.htm
[27] 范飞鹏, 肖凡, 项红亮, 等. 闽中德化邱埕钼矿床辉钼矿Re-Os同位素定年及其对成矿时间的限定[J]. 中国地质, 2021, 48(6): 1838-1849. https://www.cnki.com.cn/Article/CJFDTOTAL-DIZI202106012.htm Fan F P, Xiao F, Xiang H L, et al. Molybdenite Re-Os dating of the Qiucheng Mo deposit in Dehua of central Fujian Province and constraints on the mineralization time[J]. Geology in China, 2021, 48(6): 1838-1849. https://www.cnki.com.cn/Article/CJFDTOTAL-DIZI202106012.htm
[28] 杨富全, 李永, 陈贵民, 等. 新疆阿尔泰巴斯铁列克钨多金属矿成矿时代——来自锆石U-Pb年龄和辉钼矿Re-Os年龄约束[J]. 大地构造与成矿学, 2019, 43(6): 1144-1154. https://www.cnki.com.cn/Article/CJFDTOTAL-DGYK201906006.htm Yang F Q, Li Y, Chen G M, et al. Ore-forming age of the Basitielieke tungsten polymetallic deposit in the Altay, Xinjiang: Constraits of zircon U-Pb and molybdenite Re-Os geochronology[J]. Geotectonica et Metallogenia, 2019, 43(6): 1144-1154. https://www.cnki.com.cn/Article/CJFDTOTAL-DGYK201906006.htm
[29] 彭能立, 王先辉, 杨俊, 等. 湖南川口三角潭钨矿床中辉钼矿Re-Os同位素定年及其地质意义[J]. 矿床地质, 2017, 36(6): 1402-1414. https://www.cnki.com.cn/Article/CJFDTOTAL-KCDZ201706009.htm Peng N L, Wang X H, Yang J, et al. Re-Os dating of molybdenite from Sanjiaotan tungsten deposit in Chuankou area, Hunan Province, and its geological implications[J]. Mineral Deposits, 2017, 36(6): 1402-1414. https://www.cnki.com.cn/Article/CJFDTOTAL-KCDZ201706009.htm
[30] 李宁, 杨富全, 李超, 等. 新疆东天山小白石头钨(钼)矿辉钼矿Re-Os同位素年龄及成矿时代[J]. 岩矿测试, 2019, 38(1): 112-122. doi: 10.15898/j.cnki.11-2131/td.201805250064 Li N, Yang F Q, Li C, et al. Re-Os isotopic age of molybdenite from the Xiaobaishi W-(Mo) deposit, eastern Tianshan, Xinjiang and its geological implication[J]. Rock and Mineral Analysis, 2019, 38(1): 112-122. doi: 10.15898/j.cnki.11-2131/td.201805250064
[31] 肖昌浩, 刘向冲, 赵岩, 等. 辽东五龙金矿床构造控矿特征和辉钼矿Re-Os年龄[J]. 地球科学, 2020, 45(11): 3982-3997. https://www.cnki.com.cn/Article/CJFDTOTAL-DQKX202011007.htm Xiao C H, Liu X C, Zhao Y, et al. Structural controls and Re-Os dating of molybdenite of Wulong gold deposit, NE China[J]. Earth Science, 2020, 45(11): 3982-3997. https://www.cnki.com.cn/Article/CJFDTOTAL-DQKX202011007.htm
[32] 张朋, 李斌, 李杰, 等. 辽东裂谷白云金矿载金黄铁矿Re-Os定年及其地质意义[J]. 大地构造与成矿学, 2016, 40(4): 731-738. https://www.cnki.com.cn/Article/CJFDTOTAL-DGYK201604008.htm Zhang P, Li B, Li J, et al. Re-Os isotopic dating and its geological implication of gold bearing pyrite from the Baiyun gold deposit in Liaodong Rift[J]. Geotectonica et Metallogenia, 2016, 40(4): 731-738. https://www.cnki.com.cn/Article/CJFDTOTAL-DGYK201604008.htm
[33] 王大钊, 刘家军, 翟德高, 等. 河北东坪碲金矿床辉钼矿Re-Os及锆石U-Pb年龄研究[J]. 地学前缘, 2020, 27(2): 405-419. https://www.cnki.com.cn/Article/CJFDTOTAL-DXQY202002026.htm Wang D Z, Liu J J, Zhai D G, et al. Study on molybdenite Re-Os and zircon U-Pb ages of the Dongping tellurium-gold deposit in Hebei Province[J]. Earth Science Frontiers, 2020, 27(2): 405-419. https://www.cnki.com.cn/Article/CJFDTOTAL-DXQY202002026.htm
[34] 李金英, 郭冬发, 姚继军, 等. 电感耦合等离子体质谱(ICP-MS)新进展[J]. 质谱学报, 2002, 23(3): 164-179. https://www.cnki.com.cn/Article/CJFDTOTAL-ZPXB200203010.htm Li J Y, Guo D F, Yao J J, et al. Recent progress of inductively coupled plasma mass spectrometry (ICP-MS)[J]. Journal of Chinese Mass Spectrometry Society, 2002, 23(3): 164-179. https://www.cnki.com.cn/Article/CJFDTOTAL-ZPXB200203010.htm
[35] 方家骏, 孙卫东, 彭子成, 等. 负热电离质谱技术在锇同位素测定中的应用[J]. 质谱学报, 1997, 18(2): 7-15. https://www.cnki.com.cn/Article/CJFDTOTAL-ZPXB199702001.htm Fang J J, Sun W D, Peng Z C, et al. Application of negative thermal ionization mass spectrometry in Os isotope determination[J]. Journal of Chinese Mass Spectrometry Society, 1997, 18(2): 7-15. https://www.cnki.com.cn/Article/CJFDTOTAL-ZPXB199702001.htm
[36] 储著银, 郭春华. 地球科学中热电离质谱法的进展[J]. 现代仪器, 2003(1): 8-11, 7. https://www.cnki.com.cn/Article/CJFDTOTAL-XDYI200301003.htm Chu Z Y, Guo C H. Advances in thermal ionization mass spectrometry in geosciences[J]. Modern Instruments, 2003(1): 8-11, 7. https://www.cnki.com.cn/Article/CJFDTOTAL-XDYI200301003.htm
[37] 毛景文, 谢桂青, 程彦博, 等. 华南地区中生代主要金属矿床模型[J]. 地质论评, 2009, 55(3): 347-354. https://www.cnki.com.cn/Article/CJFDTOTAL-DZLP200903007.htm Mao J W, Xie G Q, Cheng Y B, et al. Mineral deposit models of Mesozoic ore deposits in South China[J]. Geological Review, 2009, 55(3): 347-354. https://www.cnki.com.cn/Article/CJFDTOTAL-DZLP200903007.htm
-
期刊类型引用(6)
1. Can RAO,Rucheng WANG,Fuyuan WU,Xudong CHE,Xiaofeng LI,Qi WANG,Zhiqi ZHANG,Runqiu WU. A preliminary study on the volcanic intrusive complex type beryllium metallogenic belt from the southeast coast of China. Science China(Earth Sciences). 2022(08): 1586-1600 .  必应学术
必应学术
2. 饶灿,王汝成,吴福元,车旭东,李晓峰,王琪,张志琦,吴润秋. 中国东南沿海火山-侵入杂岩型铍成矿带初步研究. 中国科学:地球科学. 2022(08): 1547-1561 . 百度学术
3. 李晓峰,吴福元,韦星林,车旭东,饶灿,陈振宇,葛文春,朱艺婷. 中国东部火山岩型铍铀矿床成矿潜力与找矿远景. 岩石学报. 2022(07): 1861-1878 . 百度学术
4. 张永清,周红英,耿建珍,肖志斌,涂家润,张然,叶丽娟. 应用激光拉曼光谱鉴别桂中铝土矿TiO_2同质异象矿物. 岩矿测试. 2022(06): 978-986 . 本站查看
5. 李晓峰,韦星林,朱艺婷,李祖福,邓宣驰. 华南稀有金属矿床:类型、特点、时空分布与背景. 岩石学报. 2021(12): 3591-3614 . 百度学术
6. 张伟盟,严杰,钟福军,潘家永,刘文泉,赖静,周堂波. 粤北石角围花岗岩型铀矿床沥青铀矿LA-ICP-MS原位U-Pb定年研究. 岩矿测试. 2019(04): 449-460 . 本站查看
其他类型引用(4)


计量
- 文章访问数: 141
- HTML全文浏览量: 39
- PDF下载量: 33
- 被引次数: 10
 京公网安备 11010202008159号