
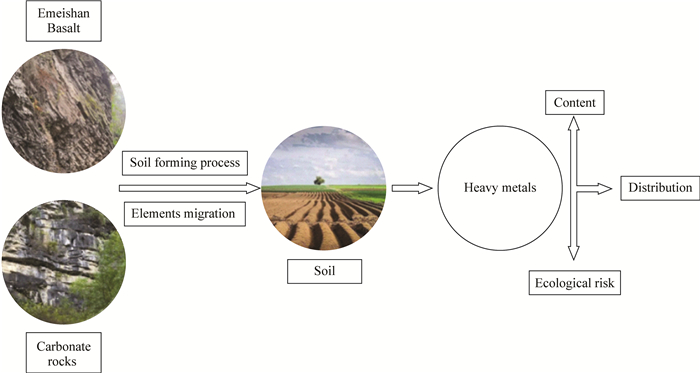
Distribution of Heavy Metals and Ecological Risk of Soils in the Typical Geological Background Region of Southwest China
-
摘要:
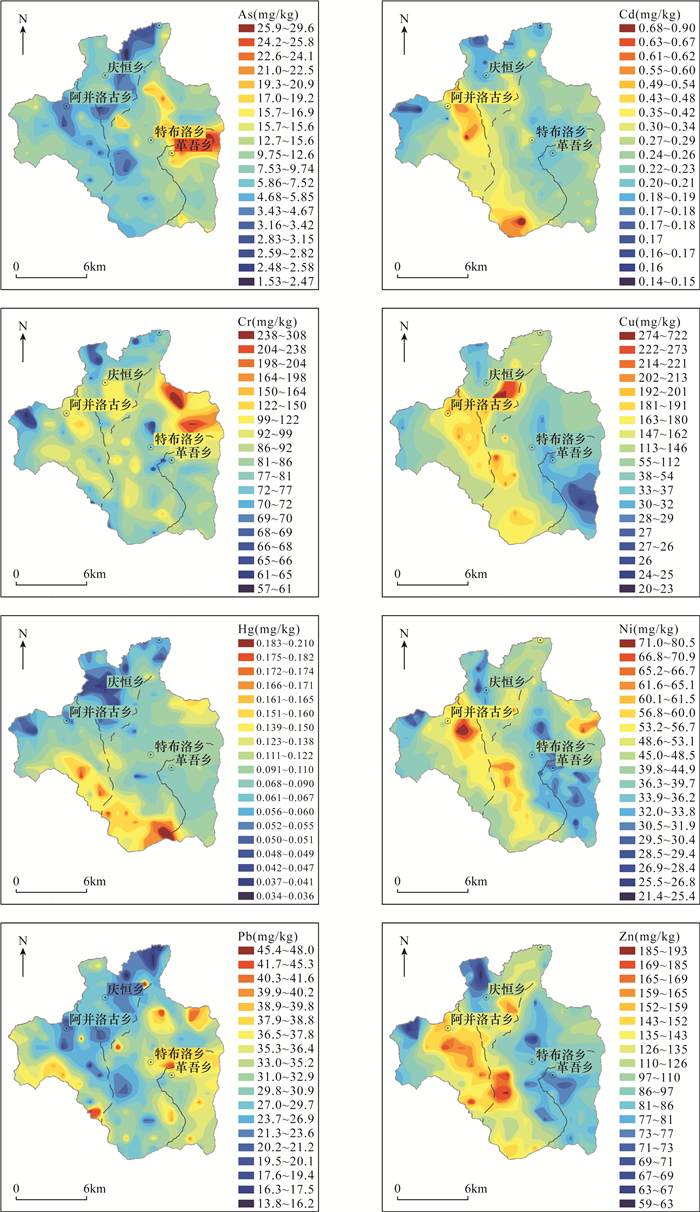
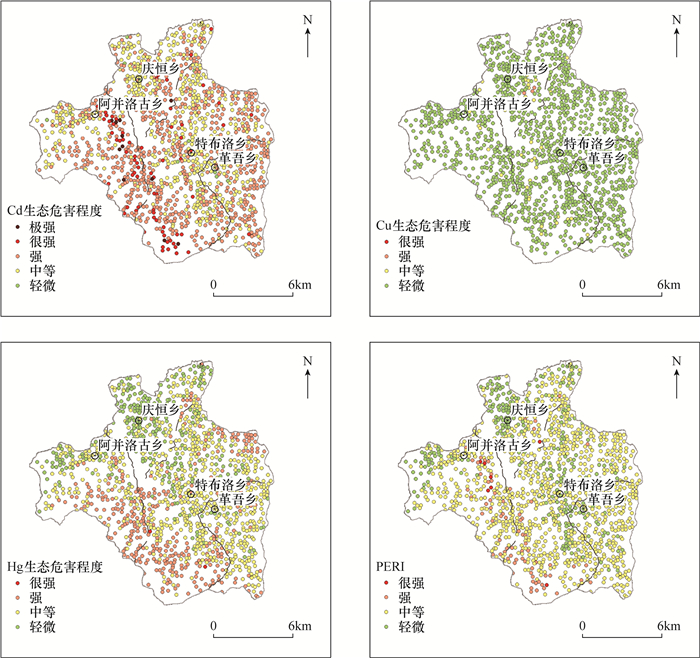
中国西南有22.3%的耕地重金属含量超标,区内广泛分布的峨眉山玄武岩和碳酸盐岩被认为是土壤中重金属的主要母质来源。目前,中国西南地区,尤其是峨眉山玄武岩分布区土壤重金属生态风险的研究程度仍有待提升,不同地质背景区(成土母岩)土壤中重金属含量、空间分布与生态风险缺乏对比。本文选择四川省典型地质背景区采集土壤样品,采用原子荧光光谱法、电感耦合等离子体质谱/发射光谱等方法测定重金属元素(As、Cd、Cr、Cu、Hg、Ni、Pb、Zn)含量和pH数据,结合地累积指数法和潜在生态风险指数法,研究了重金属元素的含量、空间分布特征和土壤重金属生态风险。结果表明:①玄武岩区土壤中Cd、Cr、Cu、Hg、Ni、Zn的含量高于碳酸盐岩区,也高于四川和全国背景值。各元素含量分别为四川背景值的3.25、1.08、5.08、1.72、1.55、1.63倍和全国背景值的2.60、1.40、6.87、1.47、1.87、1.91倍;②As、Cr、Pb的高含量区域与碳酸盐岩分布区对应,Cd、Cu、Hg、Ni、Zn的高含量区域与峨眉山玄武岩的空间分布对应;③地累积指数表明玄武岩分布区土壤中Cd、Cu、Ni、Zn污染程度高于碳酸盐岩区;④研究区内生态危害程度较高的元素为Cd、Cu和Hg;其在玄武岩分布区“强生态危害”及以上的比例比碳酸盐岩区分别高出22.4%、1.15%和26.0%。本研究揭示:①研究区内土壤中重金属元素的含量、分布及生态风险与地质背景密切相关;②产生这一规律的原因在于母岩中元素含量的差异、成土过程中元素的地球化学行为及元素次生富集等因素综合作用的结果;③研究区土壤酸碱度偏低(pH平均值为5.5),需预防土壤进一步酸化引起的重金属活化风险。
-
关键词:
- 峨眉山玄武岩 /
- 碳酸盐岩 /
- 重金属 /
- 生态危害 /
- 电感耦合等离子体质谱法
要点(1) 揭示了峨眉山玄武岩和碳酸盐岩区土壤重金属地球化学特征和生态风险的差异。
(2) 玄武岩区土壤中Cd、Cu、Hg、Ni、Zn的含量高于碳酸盐岩区和四川、全国背景值。
(3) 研究区土壤重金属元素的空间分布主要受地质背景控制。
HIGHLIGHTS(1) The geochemical characteristics and ecological risk of heavy metals in the soils of Emeishan basalt and carbonate rock areas were compared.
(2) The content of Cd, Cu, Hg, Ni and Zn in the basalt areas were higher than those in the carbonate areas and the background values of Sichuan and China.
(3) In the studied area, the spatial distribution of heavy metals in soils was mainly determined by the geological background.
Abstract:BACKGROUND22.3% of the cultivated land in southwest China has excessive heavy metal content. The widely distributed Emeishan basalt and carbonate rocks in the region are considered to be the main source of heavy metals in the soil. At present, the level of research on the ecological risk of soil heavy metals in southwestern China, especially in the Emeishan basalt areas, still needs to be improved. The content, spatial distribution and ecological risk of heavy metals in soils of different geological backgrounds (earthogenic parent rocks) lack comparison.
OBJECTIVESTo understand the content and spatial distribution characteristics of heavy metals in the soils from Emeishan basalt and carbonate rock areas.
METHODSSoil samples from the typical geological background areas of Sichuan were collected. AFS, ICP-MS and ICP-OES were used to determine the content of heavy metal elements (As, Cd, Cr, Cu, Hg, Ni, Pb, Zn) and pH values.The content and spatial distribution of the heavy metals in the soils, as well as the ecological risks were studied using the accumulation index and potential ecological risk index methods.
RESULTSThe results showed that: (1) The content of Cd, Cr, Cu, Hg, Ni, and Zn in the soils of the basalt areas were generally higher than those of the non-basalt areas and the background values of Sichuan and China. The content of the above elements were respectively 3.25, 1.08, 5.08, 1.72, 1.55, 1.63 times the Sichuan background values and 2.60, 1.40, 6.87, 1.47, 1.87, 1.91 times background values of China. (2) The high content areas of As, Cr and Pb corresponded well to the carbonate rock areas, whereas the high content areas of Cd, Cu, Hg, Ni and Zn corresponded well to the Emeishan basalt areas. The corresponding relationship indicated that the spatial distribution of heavy metals in the soil was mainly determined by the geological background in the studied area. (3) The Geoaccumulation Index results indicated that the soil pollution degree of Cd, Cu, Ni and Zn in Emeishan basalt areas was obviously higher than those of the non-basalt areas; (4) Ecological hazard index results showed that Cd, Cu and Hg were the highest ecological hazard elements in the studied area. The proportions of "strong ecological hazard", "very strong ecological hazard" and "strong estecological hazard" of Cd, Cu and Hg in the basalt areas were respectively 22.4%, 1.15% and 26.0% higher than those in the non-basalt areas.
CONCLUSIONSThe content, distribution and ecological risk of heavy metal elements in the soil in the study area are closely related to the geological background. Reasons include the differences in the element content in the parent rock, the geochemical behavior of the elements during the soil formation, and the secondary enrichment of the elements. The pH of the soil in the study area is low, and it is necessary to prevent the risk of heavy metal activation caused by further acidification of the soil.
-
石油作为基础性能源产品,对现代国家经济的可持续发展有着重大影响[1]。但随着石油的开发与利用,发生了一些溢油事故[2-3]给环境造成了重大危害[4]。石油类的污染物成分复杂,主要为石油烃和多环芳烃[5],其中石油烃能通过食物链富集而对人体健康造成危害[6],多环芳烃包含危害人体健康的致癌物质[7-8]。因此,对石油类污染物的监测已是环境保护的关注重点之一。2018年国家颁布的《土壤环境质量建设用地土壤污染风险管控标准(试行)》(GB 36600—2018)中将石油烃、多环芳烃等均列为监测项目,并制定了相应的风险筛选值和管控值,对土壤进行风险筛查和分类提供了依据,为生态环境修复提供了有力的技术支撑。
石油类污染物主要以烃类形式存在,碳、氢占比高达95%~99%[9],因此红外分光光度法相较于重量法[10]、紫外分光光度法[11-12]、气相色谱法[13-16]、荧光法[17-18]等,能更全面、准确地检测油类物质的总量,且灵敏度高、不受油品影响[19-20],对低含量油污染土壤测定更加适用[21-22]。石油类的官能团CH3、CH2和CH分别在红外光谱2930cm-1、2960cm-1和3030cm-1处存在伸缩振动,通过这三个波数处的吸光度可以计算出含CH3、CH2和CH基团的烃类含量[23]。现行环境标准《土壤石油类的测定红外分光光度法》(HJ 1051—2019)、《水质石油类和动植物油类的测定红外分光光度法》(HJ 637—2018)采用红外校正系数法计算石油类含量,通过测定正十六烷(CH3)、异辛烷(CH2)和苯(CH)三种烃类在三个波数下的吸光度,联立方程式计算校正因子X、Y、Z和F,利用校正因子来计算石油类含量[24],该计算方式相对复杂,手动计算费时费力;如采用软件计算虽可提高计算效率,但又因实际测试油品的红外光谱吸收峰的偏移,而造成计算结果偏差较大。在《生活饮用水标准检验方法有机物综合指标》(GB/T 5750.7—2006)、被代替的《水质石油类和动植物油的测定红外光度法》(GB/T 16488—1996)和杨斌等[25]、梁庆勋等[26]、马宏伟等[27]研究中均采用了标准曲线法,但国家标准中的标准曲线法采用非色散红外光谱单波数,因未考虑芳香烃的影响而存在局限性,从而导致标准曲线法的适用范围受限或被舍弃[28],而文献[25-27]中均未明确指出具体采用的波数,因此作为简单、方便的标准曲线法是否仍能使用,其计算结果是否具有代表性值得深究。
为解决校正系数法计算复杂、单波数计算范围受限等一系列问题,本文依据CH3、CH2和CH官能团在三个波数下产生的吸光度,组合成5种标准曲线法,计算已知含量的5种配制油品,通过计算结果的比对,确立最佳计算方法为三波数之和标准曲线法。再经过芳香烃占比试验对计算方法适用中国油品的范围进行验证。最后进行实际样品测定,并与校正系数法进行对比,验证其实用性。本文建立的三波数之和标准曲线法,为解决红外分光光度法测定石油类总量中标准曲线法的适用范围扩充提供了参考依据,同时也是对现行校正系数法的有益补充。
1. 实验部分
1.1 仪器和主要试剂
傅里叶变换红外光谱仪(FRONTIER型,美国PerkinElmer公司):扫描范围为2800~3200cm-1;配备4cm带盖石英比色皿。
四氯乙烯(红外光谱级,国药集团化学试剂有限公司)。
1.2 实验样品
标准物质:石油类标准溶液(1000mg/L)、正十六烷(10000mg/L)、异辛烷(10000mg/L)、苯(10000mg/L),均购自上海安谱实验科技股份有限公司。
其他油品:原油(华北油田);高温润滑油(长沙合轩化工科技有限公司);机油(壳牌全合成机油);0#柴油(中国石油化工集团有限公司);92#汽油(中国石油化工集团有限公司)。
实际样品:在工业园区调查项目中分别选取10个污染类型不同、污染程度不一的土壤和水质样品。土壤样品编号为T-1至T-10,水质样品编号为S-1至S-10。
1.3 标准曲线的绘制
将1000mg/L石油类标准溶液用四氯乙烯稀释成150、100、50、20、10、5、2mg/L标准系列,用4cm石英比色皿进行红外光谱扫描,记录2930cm-1、2960cm-1、3030cm-1处的吸光度值。
1.3.1 单波数标准曲线绘制
依据标准溶液浓度与2930cm-1、2960cm-1、3030cm-1处的吸光度分别绘制三条标准工作曲线。
1.3.2 两波数吸光度之和标准曲线绘制
依据标准溶液浓度与2930cm-1、2960cm-1处的吸光度之和绘制标准工作曲线。
1.3.3 三波数吸光度之和标准曲线绘制
依据标准溶液浓度与2930cm-1、2960cm-1、3030cm-1处的吸光度之和绘制标准工作曲线。
1.4 样品分析测试
1.4.1 配制油品
称取原油、润滑油、机油、柴油和汽油样品各0.50g,分别用四氯乙烯定容至50mL,配制成10000mg/L的储备液。再将上述各油品储备液用四氯乙烯稀释成100、50、20、10、5、2mg/L系列溶液,用4cm石英比色皿进行红外光谱扫描,得到红外光谱图,记录2930cm-1、2960cm-1、3030cm-1处的吸光度值。
1.4.2 配制不同浓度芳香烃的样品
以四氯乙烯为溶剂,吸取不同体积的正十六烷、异辛烷和苯标准溶液,按照不同比例配制成溶液,用4cm石英比色皿进行红外光谱扫描,使用三波数之和标准曲线法计算。
1.4.3 样品前处理和红外分光光谱分析
土壤样品:称取土壤样品10.0g于锥形瓶中,加入20mL四氯乙烯,置于振荡器中,振荡提取30min,静置10min后倾出提取液。再用20mL四氯乙烯提取一次,合并提取液并定容50mL。提取液流经填充硅酸镁吸附柱,弃去前5mL滤出液,保留剩余流出液,待测。
水质样品:取500mL水质样品于分液漏斗中,用50mL四氯乙烯分两次萃取,合并萃取液并定容至50mL。取适量萃取液过硅酸镁吸附柱,弃去前5mL滤出液,余下的接入25mL比色管中,用于测定石油类。
测定:以4cm石英比色皿加入四氯乙烯为参比,分别测量提取液的红外光谱图,记录2930cm-1、2960cm-1、3030cm-1处的吸光度值。
2. 结果与讨论
2.1 标准曲线、方法线性范围与检出限
按照1.3节标准曲线绘制步骤进行单波数、两波数吸光度之和与三波数吸光度之和绘制标准曲线,各标准曲线方程与相关系数见表 1,各浓度红外光谱图见图 1。
表 1 标准曲线方程与相关系数Table 1. Standard curve equations and correlation coefficients标准曲线名称 回归方程 相关系数(R) 2930cm-1标准曲线 y=0.0135x+0.015 0.9996 2960cm-1标准曲线 y=0.0078x-0.0041 0.9998 3030cm-1标准曲线 y=0.0011x-0.0013 0.9996 两波数吸光度之和标准曲线 y=0.0214x-0.008 0.9998 三波数吸光度之和标准曲线 y=0.0225x-0.0065 0.9999 如图 1所示,当标准溶液浓度为1mg/L时,红外吸收峰吸光度之和为0.083,虽满足3倍信噪比但峰不明显;当标准溶液浓度为150mg/L时,红外光谱图已出现平顶峰,因此石油类质量浓度在2~100mg/L时与其吸光度呈良好线性关系,相关系数如表 1所示全部大于0.999。以3倍信噪比(S/N)计算,最低检出浓度为1mg/L。
2.2 配制油品分析结果
浓度为100mg/L的5种油品的红外光谱图如图 2所示,不同产地和不同类型的油品,各种烃类的结构和所占比例相差很大,但主要属于CH2、CH3官能团组成的烷烃、环烷烃,CH官能团的芳香烃占比较少,与王玉纯等[23]采集中国不同油田的炼油厂废水进行测定得出芳香烃含量不高的结论相符。
读取上述5种油品各浓度相应波数的吸光度值,分别以2930cm-1、2960cm-1、3030cm-1的单波数标准曲线计算,以两波数吸光度之和标准曲线进行计算,以三波数吸光度之和标准曲线进行计算,得到其相应计算浓度。计算浓度(ρ计)与各油品配制浓度(ρ配)的相对误差(δ)按下列公式进行计算。
$$ \delta {\rm{ = }}\left( {{\rho _{计}} - {\rho _{配}}} \right)/{\rho _{配}} $$ 各油品单波数标准曲线计算结果的相对误差情况如图 3所示。由图 3a可知,原油和柴油的各浓度点相对误差较小,大致分布在20%之内,由此可知原油和柴油相较于其余油品更适合采用2930cm-1标准曲线进行计算。由图 3b可知,润滑油和机油的各浓度点相对误差较小,大致分布在20%之内,由此可知润滑油和机油的主要成分相较于其余油品更适合采用2960cm-1标准曲线进行计算。由图 3c可知,5种油品的各浓度点相对误差均在40%以上,计算浓度与配制浓度相差较大,表明5种油品中CH官能团为主的芳香烃含量较低或不存在[9],与图 2各油品的红外光谱图中3030cm-1峰较低或不存在的测试结果相符。单波数标准曲线的选择性强,不适用于多种类石油污染物的计算。
![]() 图 3 单波数标准曲线法计算各种油品的结果Figure 3. Calculation results of single wave number standard curve method for various oil products
图 3 单波数标准曲线法计算各种油品的结果Figure 3. Calculation results of single wave number standard curve method for various oil products由图 4可知,两波数之和标准曲线法计算各油品结果的相对误差均小于30%,这是因为两波数吸光度之和标准曲线法包括了CH2、CH3两个官能团产生的吸光度(图 4a),三波数吸光度之和标准曲线法包括了CH2、CH3和CH三个官能团产生的吸光度(图 4b),较单波数标准曲线法更全面。两种方法相比较,三波数吸光度之和标准曲线法计算结果的相对误差更小,更接近于配制值,说明虽然芳香烃在石油类中含量较低,但其对总量还是存在一定的影响。所以5种标准曲线法中,三波数吸光度之和标准曲线法是更适合作为计算石油类总量的方法。
![]() 图 4 吸光度之和标准曲线法计算各种油品的结果Figure 4. Calculation results of various oil products by summation of absorbance standard curve method
图 4 吸光度之和标准曲线法计算各种油品的结果Figure 4. Calculation results of various oil products by summation of absorbance standard curve method2.3 石油类污染适用范围验证结果
由2.2节可知单波数标准曲线法的选择性强,不能准确计算所有石油类污染。同样的,标准方法中的单波数非分散红外光度法由于没有考虑到芳香烃类化合物,当油品中芳烃含量超过25%时,该方法的计算结果便会产生较大误差,并不适用[28]。
为验证三波数吸光度之和标准曲线法是否存在这类问题,开展了芳香烃占比试验。表 2的计算结果表明:随着芳香烃占比的增加回收率逐渐降低,当芳香烃占比大于50%时,回收率低于70%。因为中国原油的特点是含蜡较多,属于以烷烃为主的石蜡基石油,芳香烃占比小于30%,通常油品中芳香烃含量一般不超过15%[9],所以三波数吸光度之和标准曲线法可适用于中国石油类污染的检测。
表 2 芳香烃占比试验结果Table 2. Results of the proportion test for aromatic hydrocarbons三种烃比例(正十六烷∶异辛烷∶苯) 芳香烃占比(%) 配制浓度(mg/L) 三波数之和标准曲线法 计算值(mg/L) 回收率(%) 7 ∶ 3 ∶ 0 0 50.00 59.98 119.96 6 ∶ 3 ∶ 1 10 50.00 55.42 110.83 6 ∶ 2 ∶ 2 20 50.00 52.93 105.86 5 ∶ 2 ∶ 3 30 50.00 46.70 93.39 5 ∶ 1 ∶ 4 40 50.00 43.66 87.32 3 ∶ 2 ∶ 5 50 50.00 36.55 73.10 3 ∶ 1 ∶ 6 60 50.00 33.47 66.94 2 ∶ 1 ∶ 7 70 50.00 28.24 56.48 1 ∶ 1 ∶ 8 80 50.00 22.43 44.86 1 ∶ 0 ∶ 9 90 50.00 18.65 37.29 0 ∶ 0 ∶ 10 100 50.00 13.85 27.69 2.4 方法精密度和准确度
对空白水和空白土壤(石英砂)进行加标试验,共三个浓度水平,每个浓度水平平行进行6次测定,按照1.4节进行样品前处理、三波数之和标准曲线法计算测定结果,计算其精密度与加标回收率,结果见表 3。方法精密度(RSD)在5.9%~8.0%之间,均小于10%,加标回收率在76.4%~98.2%之间,符合HJ 1051—2019、HJ 637—2018中回收率70%~110%的要求。
表 3 空白加标样品精密度结果Table 3. Precision results of blank spiked samples测定次数 土壤空白加标样品石油类物质含量(mg/kg) 水质空白加标样品石油类物质含量(mg/kg) 10mg/kg 50mg/kg 100mg/kg 0.10mg/L 0.50mg/L 2.50mg/L 1 9.11 47.6 93.4 0.0823 0.458 2.36 2 7.93 48.3 92.5 0.0764 0.403 2.13 3 9.29 47.4 91.6 0.0951 0.471 2.08 4 8.26 49.1 94.1 0.0876 0.427 2.41 5 8.74 45.7 95.7 0.0811 0.452 2.24 6 7.73 48.2 90.6 0.0798 0.485 2.33 平均值 8.51 47.7 93 0.0837 0.45 2.26 回收率(%) 77.3~92.9 91.4~98.2 91.6~95.7 76.4~95.1 80.6~97.0 83.2~96.4 RSD(%) 7.5 6.7 5.9 8.0 6.7 5.9 2.5 实际样品测定结果
按照本文的实验方法(三波数吸光度之和标准曲线法)对采集的土壤和水实际样品(1.2节)进行测定,将三波数吸光度之和标准曲线法计算结果与标准方法HJ 637—2018、HJ 1051—2019中的校正系数法计算结果进行对比。如表 4所示,对于实际土壤样品两种测试结果的相对偏差在0.5%~4.8%,水样品的相对偏差在-5.3%~6.7%,
表 4 实际样品的计算结果对比Table 4. Comparison of calculation results for actual samples土壤样品编号 土壤样品中石油类物质含量(mg/kg) 水样品编号 水样品中石油类物质含量(mg/L) 校正系数法
(标准方法)三波数之和标准曲线法
(本文方法)相对偏差
(%)校正系数法
(标准方法)三波数之和标准曲线法
(本文方法)相对偏差
(%)T-1 17.4 18.5 -3.1 S-1 0.08 0.07 6.7 T-2 9.73 9.82 -0.5 S-2 0.11 0.12 -4.3 T-3 87.9 90.9 -1.7 S-3 0.09 0.1 -5.3 T-4 104 94.8 4.6 S-4 0.67 0.65 1.5 T-5 374 393 -2.5 S-5 0.88 0.92 -2.2 T-6 646 689 -3.2 S-6 0.79 0.84 -3.1 T-7 1235 1304 -2.7 S-7 1.25 1.18 2.9 T-8 1647 1723 -2.3 S-8 1.34 1.26 3.1 T-9 5386 5839 -4.0 S-9 1.87 1.67 5.6 T-10 20880 22342 -3.4 S-10 2.07 2.14 -1.7 注:相对偏差=(推荐方法测定值-两次测定值的平均值)/两次测定值平均值×100%。 参考HJ 1051—2019中土壤平行样的相对偏差≤30%、HJ 637—2018中水样实验室内标准偏差的范围为0.8%~13%,测试结果满足要求,因此三波数吸光度之和标准曲线法可作为实际测定石油类总量的方法。
3. 结论
本文建立了三波数之和标准曲线法计算环境样品中石油类总量的方法。依据标准曲线法原理和常见油品红外谱图,对红外分光光度法测定石油类的三个波数处的吸光度进行排列组合,组建出5种标准曲线法计算已知含量的5种油品,并进行结果比对,表明三波数之和标准曲线法包含的波数全面,结果更接近实际配制值,是标准曲线法中的最佳计算方法。再经过芳香烃占比试验和实际样品验证,表明本文方法在芳香烃占比小于50%时,与校正系数法结果相一致,能满足石油类污染的测定需求。
三波数之和标准曲线法的建立,解决了标准曲线法在红外分光光度法测定石油类总量中的应用难题,突破了单波数标准曲线法的局限性,同时具有简单、方便、准确等特点,是对现行校正系数法的有益补充。但对于芳香烃占比大于50%的石油类污染,计算结果偏差较大,需进一步探讨研究。
致谢: 桂林理工大学研究生黄文斌、何旺、李帅、曹宁在野外样品采集过程中付出了辛勤的劳动,河南省岩石矿物测试中心承担了样品分析测试任务,在此一并致谢! -
![]()
图 2 研究区地质简图
注:雷口坡组:黄灰色中厚层白云岩,夹灰岩、膏盐、盐溶角砾岩;须家河组:灰黄色岩屑长石砂岩、粉砂岩、泥岩,产煤;峨眉山玄武岩组:灰绿色致密、杏仁状玄武岩,夹苦橄岩、凝灰质砂泥岩、煤线及硅质岩;新村组:紫红色泥页岩、粉砂岩及细-中粒砂岩互层;益门组:紫红、灰绿色泥岩、夹细-粉砂岩及生物屑灰岩;飞仙关组、嘉陵江组、雷口坡组并层:白云岩、灰岩、页岩;飞仙关组、嘉陵江组并层:灰岩、白云岩、页岩。
Figure 2. Geological map in the research area
![]()
图 3 调查区土壤重金属元素地球化学图
Figure 3. Geochemistry maps of heavy metals in soil of the research area
![]()
图 4 镉、铜、汞单元素生态危害程度和调查区总体潜在生态危害指数分布图
Figure 4. Ecological risk of Cd, Cu, Hg and PERI in the research area
表 1 各指标分析测试检出限
Table 1 Detection limit of analyzed indicators
分析项目 检出限 单位 分析项目 检出限 单位 As 0.3 mg/kg Ni 1 mg/kg Cd 0.03 mg/kg Pb 2 mg/kg Cr 3 mg/kg Zn 2 mg/kg Cu 0.5 mg/kg pH 0.1 / Hg 0.0005 mg/kg  下载: 导出CSV
表 2 不同地质背景区土壤重金属元素含量统计
Table 2 Heavy metals content in soil of different background
背景区 统计值 As Cd Cr Cu Hg Ni Pb Zn pH 玄武岩分布区
(n=521)最小值 1.10 0.10 42.4 21.9 0.017 26.0 9.30 54 4.70 最大值 15.9 0.55 134 325 0.237 78.6 50.2 228 6.30 算术平均值 6.10 0.27 85.4 158 0.109 50.8 27.4 139 5.40 中位数 5.30 0.26 85.2 158 0.103 50.5 26.6 141 5.30 标准离差 3.40 0.09 16.3 58.2 0.048 9.50 7.80 29 0.30 变异系数 0.56 0.34 0.19 0.37 0.44 0.19 0.28 0.21 0.05 非玄武岩分布区
(n=807)最小值 1.70 0.04 41.5 14.9 0.020 17.0 13.9 38 4.30 最大值 32.3 0.40 127 65.3 0.190 60.9 48.6 128 6.60 算术平均值 12.2 0.22 83.5 35.2 0.084 36.8 32.4 83 5.40 中位数 10.8 0.21 82.6 32.2 0.081 35.6 32.8 83 5.30 标准离差 6.90 0.06 14.7 10.5 0.033 8.40 6.30 15 0.40 变异系数 0.56 0.27 0.18 0.30 0.39 0.23 0.19 0.18 0.07 四川[29] 算术平均值 10.4 0.08 79 31.1 0.06 32.6 30.9 86.5 6.6 全国[29] 算术平均值 11 0.10 61 23 0.07 27 26 74 / 注:表中8种重金属元素含量单位为mg/kg,pH无量纲。“/”表示文献中未提供数据。
下载: 导出CSV
表 3 研究区不同地质背景区土壤重金属元素地累积指数等级比例
Table 3 Geoaccumulation index of soil heavy metals in area of different background
背景区 重金属元素 各元素不同地累积指数级别的样品数占该区域样品总数的百分比(%) Igeo≤0 0 < Igeo ≤1 1 < Igeo≤ 2 2 < Igeo ≤ 3 3 < Igeo ≤ 4 4 < Igeo ≤ 5 Igeo>5 玄武岩分布区
(n=521)As 98.3 1.7 0 0 0 0 0 Cd 1.2 37.8 51.2 7.9 1.1 0.8 0 Cr 92.9 6.7 0.4 0 0 0 0 Cu 3.45 8.6 56.6 29.7 1.0 0.6 0 Hg 40.9 50.5 8.6 0 0 0 0 Ni 42.2 56.8 1.0 0 0 0 0 Pb 97.3 2.7 0 0 0 0 0 Zn 34.5 65.5 0 0 0 0 0 碳酸盐岩分布区
(n=807)As 74.6 23.9 1.5 0 0 0 0 Cd 2.5 63.1 33.8 0.6 0 0 0 Cr 90.5 6.9 2.6 0 0 0 0 Cu 69.9 19.2 8.4 2.4 0.1 0 0 Hg 58.6 39.8 1.6 0 0 0 0 Ni 87.2 12.8 0 0 0 0 0 Pb 98.3 1.7 0 0 0 0 0 Zn 94.1 5.9 0 0 0 0 0
下载: 导出CSV
表 4 调查区内不同背景区土壤重金属元素潜在生态危害系数(Eri)
Table 4 Potential ecological risk coefficient of soil heavy metals in different background
背景区 重金属元素 各元素不同生态危害程度的样品数占该区域样品总数的百分比(%) 危害程度
轻微
(Eri<40)危害程度
中等
(40≤Eri<80)危害程度
强
(80≤Eri<160)危害程度
很强
(160≤Eri<320)危害程度
极强
(Eri≥320)玄武岩区
(n=521)As 100 0 0 0 0 Cd 0.6 26.7 58.9 11.3 2.5 Cr 100 0 0 0 0 Cu 92.1 6.7 1.0 0.2 0 Hg 17.3 41.7 40.9 0.2 0 Ni 100 0 0 0 0 Pb 100 0 0 0 0 Zn 100 0 0 0 0 碳酸盐岩区
(n=807)As 100 0 0 0 0 Cd 1.4 48.3 48.7 1.6 0 Cr 100 0 0 0 0 Cu 99.3 0.7 0 0 0 Hg 26.3 58.6 15.0 0.1 0 Ni 100 0 0 0 0 Pb 100 0 0 0 0 Zn 100 0 0 0 0 注:表格中的“0”,以As元素为例,即玄武岩区所有样品As的生态危害程度均为“轻微”级别,所占比例为100%;其他级别的样品数为0,占样品总数的比例也为0,以此类推。
下载: 导出CSV
-
[1] 中国地质调查局. 中国耕地质量调查报告(2015年)[DB/OL]. http://zrzy.jiangsu.gov.cn/upfile/File/201512/10/10431190.pdf (2015). China Geological Survey. Investigation report on cultivated land quality in China (2015)[DB/OL]. http://zrzy.jiangsu.gov.cn/upfile/File/201512/10/10431190.pdf (2015).
[2] Wang C Y, Sun X F, Wang M, et al. Chinese cropland quality and its temporal and spatial changes due to urbanization in 2000-2015[J]. Journal of Resources and Ecology, 2019, 10(2): 174-183. doi: 10.5814/j.issn.1674-764x.2019.02.008
[3] 朱瑕, 张立亭, 靳焕焕. 基于因素法和SVM模型的耕地质量评价方法研究[J]. 土壤通报, 2020, 51(3): 561-567. https://www.cnki.com.cn/Article/CJFDTOTAL-TRTB202003008.htm Zhu X, Zhang L T, Jin H H. Cultivated land quality assessment methodology based on factor method and SVM model[J]. Chinese Journal of Soil Science, 2020, 51(3): 561-567. https://www.cnki.com.cn/Article/CJFDTOTAL-TRTB202003008.htm
[4] 向梦杰, 胡晓亮. 溧阳市耕地质量空间分布特征与保护分区研究[J]. 土壤通报, 2020, 51(1): 18-25. https://www.cnki.com.cn/Article/CJFDTOTAL-TRTB202001004.htm Xiang M J, Hu X L. Spatial distribution and protection zoning of cultivated land in Liyang[J]. Chinese Journal of Soil Science, 2020, 51(1): 18-25. https://www.cnki.com.cn/Article/CJFDTOTAL-TRTB202001004.htm
[5] 侯磊, 段建南, 李萍, 等. 国内耕地质量研究知识图谱分析[J]. 湖北农业科学, 2019, 58(11): 135-140. https://www.cnki.com.cn/Article/CJFDTOTAL-HBNY201911034.htm Hou L, Duan J N, Li P, et al. Analysis of knowledge graph of cultivated land quality research in China[J]. Hubei Agricultural Sciences, 2019, 58(11): 135-140. https://www.cnki.com.cn/Article/CJFDTOTAL-HBNY201911034.htm
[6] 陈文轩, 李茜, 王珍, 等. 中国农田土壤重金属空间分布特征及污染评价[J]. 环境科学, 2020, 41(6): 2822-2833. https://www.cnki.com.cn/Article/CJFDTOTAL-HJKZ202006041.htm Chen W X, Li Q, Wang Z, et al. Spatial distribution characteristics and pollution evaluation of heavy metals in arable land soil of China[J]. Environmental Science, 2020, 41(6): 2822-2833. https://www.cnki.com.cn/Article/CJFDTOTAL-HJKZ202006041.htm
[7] 成杭新, 彭敏, 赵传冬, 等. 表生地球化学动力学与中国西南土壤中化学元素分布模式的驱动机制[J]. 地学前缘, 2019, 26(6): 159-191. https://www.cnki.com.cn/Article/CJFDTOTAL-DXQY201906021.htm Chen H X, Peng M, Zhao C D, et al. Epigenetic geochemical dynamics and driving mechanisms of distribution patterns of chemical elements in soil, southwest China[J]. Earth Science Frontiers, 2019, 26(6): 159-191. https://www.cnki.com.cn/Article/CJFDTOTAL-DXQY201906021.htm
[8] 唐瑞玲, 王惠艳, 吕许朋, 等. 西南重金属高背景区农田系统土壤重金属生态风险评价[J]. 现代地质, 2020, 34(5): 917-927. https://www.cnki.com.cn/Article/CJFDTOTAL-XDDZ202005005.htm Tang R L, Wang H Y, Lv X P, et al. Ecological risk assessment of heavy metals in farmland system from an area with high background of heavy metals, southwestern China[J]. Geoscience, 2020, 34(5): 917-927. https://www.cnki.com.cn/Article/CJFDTOTAL-XDDZ202005005.htm
[9] 李括, 彭敏, 赵传冬, 等. 全国土地质量地球化学调查二十年[J]. 地学前缘, 2019, 26(6): 128-158. https://www.cnki.com.cn/Article/CJFDTOTAL-DXQY201906020.htm Li K, Peng M, Zhao C D, et al. Vicennial implementation of geochemical survey of land quality in China[J]. Earth Science Frontiers, 2019, 26(6): 128-158. https://www.cnki.com.cn/Article/CJFDTOTAL-DXQY201906020.htm
[10] 陈满怀. 环境土壤学[M]. 北京: 科学出版社, 2005. Chen M H. Environmental pedology[M]. Beijing: Science Press, 2005.
[11] Jiao W T, Chen W P, Chang A C, et al. Environmental risks of trace elements associated with long-term phosphate fertilizers applications: A review[J]. Environmental Pollution, 2012, 168: 44-53. doi: 10.1016/j.envpol.2012.03.052
[12] 罗慧, 刘秀明, 王世杰, 等. 中国南方喀斯特集中分布区土壤Cd污染特征及来源[J]. 生态学杂志, 2018, 37(5): 1538-1544. https://www.cnki.com.cn/Article/CJFDTOTAL-STXZ201805032.htm Luo H, Liu X M, Wang S J, et al. Pollution characteristics and sources of cadmium in soils of the Karst Area in South China[J]. Chinese Journal of Ecology, 2018, 37(5): 1538-1544. https://www.cnki.com.cn/Article/CJFDTOTAL-STXZ201805032.htm
[13] 和淑娟, 李丽娜, 杨牧青, 等. 云南某冰川侵蚀区域土壤高背景值成因及农作物重金属累积规律探究[J]. 环境科学导刊, 2020, 40(2): 68-75. He S J, Li L N, Yang M Q, et al. Research on the causes of high soil background value and the accumulation of heavy metals in crops in a glacier eroded area in Yunnan[J]. Environmental Science Survey, 2020, 40(2): 68-75.
[14] 张富贵, 彭敏, 王惠艳, 等. 基于乡镇尺度的西南重金属高背景区土壤重金属生态风险评价[J]. 环境科学, 2020, 41(9): 4197-4209. https://www.cnki.com.cn/Article/CJFDTOTAL-HJKZ202009038.htm Zhang F G, Peng M, Wang H Y, et al. Ecological risk assessment of heavy metals at township scale in the high background of heavy metals, southwestern, China[J]. Environmental Science, 2020, 41(9): 4197-4209. https://www.cnki.com.cn/Article/CJFDTOTAL-HJKZ202009038.htm
[15] 刘意章, 肖唐付, 熊燕, 等. 西南高镉地质背景区农田土壤与农作物的重金属富集特征[J]. 环境科学, 2019, 40(6): 2877-2884. https://www.cnki.com.cn/Article/CJFDTOTAL-HJKZ201906045.htm Liu Y Z, Xiao T F, Xiong Y, et al. Accumulation of heavy metals in agricultural soils and crops from an area with a high geochemical background of cadmium, southwestern China[J]. Environmental Science, 2019, 40(6): 2877-2884. https://www.cnki.com.cn/Article/CJFDTOTAL-HJKZ201906045.htm
[16] 韩伟, 王成文, 彭敏, 等. 川南山区土壤与农作物重金属特征及成因[J]. 环境科学, https://doi.org/10.13227/j.hjkx.202008257. Han W, Wang C W, Peng M, et al. Characteristics and origin of heavy metals in soil and crops in mountain area of southern Sichuan[J]. Environmental Science. https://doi.org/10.13227/j.hjkx.202008257.
[17] Thompson G M, Ali J R, Song X Y, et al. Emeishan basalts, SW China: Reappraisal of the formation's type area stratigraphy and a discussion of its significance as a large igneous province[J]. Journal of the Geological Society, 2001, 158: 593-599. doi: 10.1144/jgs.158.4.593
[18] Courtillot V E, Renne P R. On the ages of flood basalt events Surlȃge des trapps basaltiques[J]. Comptes Rendus-Geoscience, 2003, 335: 113-140.
[19] Hanski E, Richard J, Walker H H, et al. Origin of the Permian-Triassic komatiites, northwestern Vietnam[J]. Contributions to Mineralogy and Petrology, 2004, 147: 453-469. doi: 10.1007/s00410-004-0567-1
[20] Xu Y G, He B. Thick, high-velocity crust in the Emeishan large igneous province, southwestern China: Evidence for crustal growth by magmatic underplating or intraplating[J]. Article in Special Paper of the Geological Society of America, 2007, DOI: 10.1130/2007.2430(39).
[21] 刘成英, 朱日祥. 试论峨眉山玄武岩的地球动力学意义[J]. 地学前缘, 2009, 16(2): 52-69. doi: 10.3321/j.issn:1005-2321.2009.02.003 Liu C Y, Zhu R X. Discussion on geodynamic significance of the Emeishan basalts[J]. Earth Science Frontiers, 2009, 16(2): 52-69. doi: 10.3321/j.issn:1005-2321.2009.02.003
[22] 李一蒙, 马建华, 刘德新, 等. 开封城市土壤重金属污染及潜在生态风险评价[J]. 环境科学, 2015, 36(3): 1037-1044. https://www.cnki.com.cn/Article/CJFDTOTAL-HJKZ201503043.htm Li Y M, Ma J H, Liu D X, et al. Assessment of heavy metal pollution and potential ecological risk of urban soil in Kaifeng City, China[J]. Environmental Science, 2015, 36(3): 1037-1044. https://www.cnki.com.cn/Article/CJFDTOTAL-HJKZ201503043.htm
[23] 陈佳林, 李仁英, 谢晓金, 等. 南京市绿地土壤重金属分布特征及其污染评价[J]. 环境科学, 2021, 42(2): 909-916. Chen J L, Li R Y, Xie X J, et al. Distribution characteristics and pollution evaluation of heavy metals in greenbelt soils of Nanjing City[J]. Environmental Science, 2021, 42(2): 909-916.
[24] 胡月琪, 郭建辉, 张超, 等. 北京市道路扬尘重金属污染特征及潜在生态风险[J]. 环境科学, 2019, 40(9): 3924-3934. https://www.cnki.com.cn/Article/CJFDTOTAL-HJKZ201909009.htm Hu Y Q, Guo J H, Zhang C, et al. Pollution characteristics and potential ecological risks of heavy metals in road dust in Beijing[J]. Environmental Science, 2019, 40(9): 3924-3934. https://www.cnki.com.cn/Article/CJFDTOTAL-HJKZ201909009.htm
[25] 顾涛, 赵信文, 胡雪原, 等. 珠海市新马墩村农业园区土壤重金属分布特征及风险评价[J]. 岩矿测试, 2018, 37(4): 419-430. doi: 10.15898/j.cnki.11-2131/td.201712100190 Gu T, Zhao X W, Hu X Y, et al. Distribution on characteristics and risk assessment of heavy metals in soil from an agricultural park of Xinma Dun Village, Zhuhai City[J]. Rock and Mineral Analysis, 2018, 37(4): 419-430. doi: 10.15898/j.cnki.11-2131/td.201712100190
[26] Müller G. Index of geoaccumulation in sediments of the Rhine River[J]. Geology Journal, 1969, 2(3): 109-118. http://ci.nii.ac.jp/naid/10030367619
[27] Hakanson L. An ecological risk index for aquatic pollution control-A sedimentological approach[J]. Water Research, 1980, 14(8): 975-1001. doi: 10.1016/0043-1354(80)90143-8
[28] Loska K, Wiechulła D, Korus I. Metal contamination of farming soils affected by industry[J]. Environment International, 2004, 30: 159-165.
[29] 中国环境监测总站. 中国土壤元素背景值[M]. 北京: 中国环境科学出版社, 1990. China National Environmental Monitoring Center. Background value of soil elements in China[M]. Beijing: China Environmental Science Press, 1990.
[30] Wilding L P. Spatial variability: Its documentation, accommodation and implication to soil surveys[J]. Spatial Variations, 1985: 166-194. http://www.researchgate.net/publication/284417458_Spatial_variability_Its_documentation_accommodation_and_implication_to_soil_survey
[31] 吴月照, 潘懋. 中国东部玄武岩地区母岩及土壤元素含量变化规律研究[J]. 环境科学进展, 1993(5): 26-36. https://www.cnki.com.cn/Article/CJFDTOTAL-HJJZ199305002.htm Wu Y Z, Pan M. Study on the regularity of changes of contents of the parent rock and soil elements in the basalt regions, eastern China[J]. Advances in Environmental Science, 1993(5): 26-36. https://www.cnki.com.cn/Article/CJFDTOTAL-HJJZ199305002.htm
[32] 陈静生, 洪松, 邓宝山, 等. 中国东部花岗岩、玄武岩及石灰岩上土壤微量元素含量的纬向分异[J]. 土壤与环境, 1999, 8(3): 161-167. doi: 10.3969/j.issn.1674-5906.1999.03.001 Chen J S, Hong S, Deng B S, et al. Geographical tendencies of trace element contents in soils derived from granite, basalt and limestone of eastern China[J]. Soil and Environmental Sciences, 1999, 8(3): 161-167. doi: 10.3969/j.issn.1674-5906.1999.03.001
[33] 洪涛, 孔祥胜, 岳祥飞. 滇东南峰丛洼地土壤重金属含量、来源及潜在生态风险评价[J]. 环境科学, 2019, 40(10): 4620-4627. https://www.cnki.com.cn/Article/CJFDTOTAL-HJKZ201910036.htm Hong T, Kong X S, Yue X F. Concentration characteristics, source analysis, and potential ecological risk assessment of heavy metals in a peak-cluster depression area, southeast of Yunnan Province[J]. Environmental Science, 2019, 40(10): 4620-4627. https://www.cnki.com.cn/Article/CJFDTOTAL-HJKZ201910036.htm
[34] 宋波, 王佛鹏, 周浪, 等. 广西高镉异常区水田土壤Cd含量特征及生态风险评价[J]. 环境科学, 2019, 40(5): 2443-2452. https://www.cnki.com.cn/Article/CJFDTOTAL-HJKZ201905053.htm Song B, Wang F P, Zhou L, et al. Cd content characteristics and ecological risk assessment of paddy soil in high cadmium anomaly area of Guangxi[J]. Environmental Science, 2019, 40(5): 2443-2452. https://www.cnki.com.cn/Article/CJFDTOTAL-HJKZ201905053.htm
[35] Xu Y G, Chung S L, Jahn B M, et al. Petrologic and geochemical constraints on the petrogenesis of Permian-Triassic Emeishan flood basalts in southwestern China[J]. Lithos, 2001, 58: 145-168. http://www.sciencedirect.com/science/article/pii/S002449370100055X
[36] 胡瑞忠, 陶琰, 钟宏, 等. 地幔柱成矿系统: 以峨眉山地幔柱为例[J]. 地学前缘, 2005, 12(1): 42-54. doi: 10.3321/j.issn:1005-2321.2005.01.007 Hu R Z, Tao Y, Zhong H, et al. Mineralization systems of a mantle plume: A case study from the Emeishan igneous province, southwest China[J]. Earth Science Frontiers, 2005, 12(1): 42-54. doi: 10.3321/j.issn:1005-2321.2005.01.007
[37] 叶德宪, 李昆. 四川土壤养分及酸碱性变化趋势分析[J]. 西南农业学报, 2003, 16(增刊): 101-107. https://www.cnki.com.cn/Article/CJFDTOTAL-XNYX2003S1024.htm Ye D X, Li K. Analysis of the variation of soil nutrient contents and soil pH in Sichuan Province[J]. Southwest China Journal of Agricultural Sciences, 2003, 16(Supplement): 101-107. https://www.cnki.com.cn/Article/CJFDTOTAL-XNYX2003S1024.htm
[38] 李珊, 肖怡, 李启权, 等. 近30年川中丘陵县域表层土壤pH值时空变化分析——以四川仁寿县为例[J]. 四川农业大学学报, 2015, 33(4): 377-384. https://www.cnki.com.cn/Article/CJFDTOTAL-SCND201504005.htm Li S, Xiao Y, Li Q Q, et al. Temporal and spatial variation of top soil pH value in hilly area of middle Sichuan Basin during 1981-2012: A case study in Renshou County, Sichuan[J]. Journal of Sichuan Agricultural University, 2015, 33(4): 377-384. https://www.cnki.com.cn/Article/CJFDTOTAL-SCND201504005.htm
[39] 王珊, 廖桂堂, 熊鸿焰, 等. 川南地区耕地土壤pH时空变化分析——以宜宾市南溪区长兴镇为例[J]. 内江师范学院学报, 2013, 28(2): 52-55. https://www.cnki.com.cn/Article/CJFDTOTAL-NJSG201302014.htm Wang S, Liao G T, Xiong H Y, et al. Analysis of spatial and temporal change of the farmland soil pH in southern Sichuan Province-A case study of Changxi, Nanxi District of Yibin[J]. Journal of Neijiang Normal University, 2013, 28(2): 52-55. https://www.cnki.com.cn/Article/CJFDTOTAL-NJSG201302014.htm
[40] 周国华. 土壤重金属生物有效性研究进展[J]. 物探与化探, 2014, 38(6): 1097-1106. https://www.cnki.com.cn/Article/CJFDTOTAL-WTYH201406001.htm Zhou G H. Recent progress in the study of heavy metal bioavailability in soil[J]. Geophysical and Geochemical Exploration, 2014, 38(6): 1097-1106. https://www.cnki.com.cn/Article/CJFDTOTAL-WTYH201406001.htm
[41] Jin C W, Zheng S J, He Y F, et al. Lead contamination in tea garden soils and factors affecting its bioavailability[J]. Chemosphere, 2005, 59: 1151-1159.
[42] Mcbride M, Sauvea S, Hendershot W. Solubility control of Cu, Zn, Cd and Pb in contaminated soils[J]. European Journal of Soil Science, 1997, 48: 337-346.
[43] Nordberg G F. Cadmium and health in the 21st Century -Historical remarks and trends for the future[J]. BioMetals, 2004, 17: 485-489.
[44] Bjørklund G, Chirumbolo S, Dadar M, et al. Mercury exposure and its effects on fertility and pregnancy outcome[J]. Basic Clinical Pharmacology Toxicology, 2019, 125: 317-327. http://d.wanfangdata.com.cn/periodical/ChlQZXJpb2RpY2FsRW5nTmV3UzIwMjEwMzAyEiA4MjM5MzlkZjAzOGU2MDg2OGM4Nzg4NDcxNTJkZTJkMBoIeWJzeGs4aGY%3D
[45] 李平, 陈敏, 王波. 中国居民甲基汞暴露的来源和健康风险[J]. 矿物岩石地球化学通报, 2019, 38(4): 725-728. https://www.cnki.com.cn/Article/CJFDTOTAL-KYDH201904007.htm Li P, Chen M, Wang B. Sources and health risks of methylmercury exposure in Chinese residents[J]. Bulletin of Mineralogy, Petrology and Geochemistry, 2019, 38(4): 725-728. https://www.cnki.com.cn/Article/CJFDTOTAL-KYDH201904007.htm
[46] Bhattacharya P T, Misra S R, Hussain M. Nutritional aspects of essential trace elements in oral health and disease: An extensive review[J]. Scientifica, 2016: 1-12. http://europepmc.org/articles/PMC4940574/
[47] Ameh T, Sayes C M. The potential exposure and hazards of copper nanoparticles: A review[J]. Environmental Toxicology and Pharmacology, 2019, 71: 1-8. http://www.sciencedirect.com/science/article/pii/S1382668919300912
[48] 贺灵, 孙彬彬, 吴超, 等. 浙江省江山市猕猴桃果园土壤环境质量与生态风险评价[J]. 岩矿测试, 2019, 38(5): 524-533. doi: 10.15898/j.cnki.11-2131/td.201901080003 He L, Sun B B, Wu C, et al. Assessment of soil environment quality and ecological risk for kiwifruit orchard in Jiangshan City, Zhejiang Province[J]. Rock and Mineral Analysis, 2019, 38(5): 524-533. doi: 10.15898/j.cnki.11-2131/td.201901080003
[49] 王立婷, 刘仁志. 土壤污染的健康风险评价研究进展[J]. 中国环境管理, 2020(2): 62-68. https://www.cnki.com.cn/Article/CJFDTOTAL-KXTB201210009.htm Wang L T, Liu R Z. Research progress on soil pollution risk assessment[J]. Chinese Journal of Environmental Management, 2020(2): 62-68. https://www.cnki.com.cn/Article/CJFDTOTAL-KXTB201210009.htm
-
期刊类型引用(6)
1. 卢碧翠,张修华,王智青,张红进,刘丽立,潘晓瑜,杨明生,黄中伟,陈奇志. 提高电解二氧化锰中间控制磨粉样铁含量检测效率的研究. 中国锰业. 2024(03): 60-63 .  百度学术
百度学术
2. 杨精存,丁杭冰,施亚菁. 磁性固相萃取-电感耦合等离子体质谱(ICP-MS)法同时检测制革废水多种重金属元素. 皮革与化工. 2024(05): 20-25 . 百度学术
3. 冯先进,杨斐. 电感耦合等离子体串联质谱技术特点及国内应用现状. 冶金分析. 2023(09): 1-13 . 百度学术
4. 严煜,韩乃旭,卢水淼,夏晓峰,林黎,张秀丽. 工业在线-电感耦合等离子体发射光谱法分析湿法冶炼硫酸锌溶液中铜镉钴铁. 岩矿测试. 2022(01): 153-159 . 本站查看
5. 王干珍,彭君,李力,秦毅,曹健,田宗平. 锰矿石成分分析标准物质研制. 岩矿测试. 2022(02): 314-323 . 本站查看
6. 王凯凯. 等离子质谱在水环境重金属检测中的应用. 冶金管理. 2021(11): 163-164 . 百度学术
其他类型引用(0)


计量
- 文章访问数: 3127
- HTML全文浏览量: 928
- PDF下载量: 93
- 被引次数: 6
 京公网安备 11010202008159号