
Microstructure Characterization and Mineral Morphology of Tea-Dust Glaze Made in the Ding Kiln of the Northern Song Dynasty
-
摘要:
茶叶末釉古瓷作为最早出现的结晶釉之一,开展深入研究可明确其矿物晶体特征、呈色机理以及古代烧制工艺,丰富古陶瓷数据库。目前相关研究多来源于二十世纪末,样本稀少且囊括的年代和窑口严重不足,所用科学仪器多已淘汰,亟需更多实验分析与数据支撑。本文采用光学显微镜(OM)、激光剥蚀电感耦合等离子体质谱(LA-ICP-MS)、扫描电镜-能谱(SEM-EDS)、激光共聚焦拉曼光谱(LRS)、飞行时间二次离子质谱(ToF-SIMS)等现代科学仪器对北宋定窑茶叶末釉样本中矿物晶体开展了分析和表征。结果表明,釉中主晶相与辽金龙泉务窑一致,为钙长石和辉石;釉面整体表现为酱-黑色釉基质富铁(Fe2O3含量均值9.73%)和矿物结晶富铁(Fe2O3含量均值11.33%),除α-Fe2O3和Fe3O4晶体等熔后重结晶矿物,还有铁镁尖晶石、残余高岭石等未融熔矿物,反演出制釉原料中有镁的加入以及烧成温度可能低于1200℃,异于前人高温烧制的观点。SIMS离子成像揭示了胎釉交界处为厚约20~80μm的钙长石晶体层,而非化妆土或玻璃态的致密反应层。研究揭示了茶叶末古瓷中Fe元素不均匀富集,部分区域过饱和而析出含铁矿物晶体,釉面颜色则主要由黄褐色的矿物晶体斑点和酱-黑色玻璃基质共同组成,同时ToF-SIMS在古瓷微区原位的形貌结构和元素分析上效果显著,能够辨别钙长石、碱性长石等微米级矿物。
要点(1)茶叶末釉属铁系结晶釉,表现为黄褐色矿物晶体和酱-黑色釉基质富铁。
(2)釉面原料残余的高岭石反演出本研究样本烧成温度可能低于1200℃。
(3) ToF-SIMS在古陶瓷微区原位上能够实现微米级矿物辨别。
HIGHLIGHTS(1) Tea-dust glaze belongs to the iron system of crystallization glaze, which is manifested as tan mineral crystals and sauce-black glaze matrix rich in iron.
(2) The residual kaolinite of glazed raw materials shows that the firing temperature of the samples in this study was most likely below 1200℃.
(3) ToF-SIMS can distinguish micron-level mineral discrimination in situ on ancient ceramics.
Abstract:The tea-dust glaze ancient porcelain is one of the earliest crystalline glazes, which is rarely studied deeply because of its rarity. In this study, the mineral crystals in tea-dust glaze made in the Ding Kiln of the Northern Song Dynasty were analyzed by optical microscope (OM), laser ablation-inductively coupled plasma-mass spectrometry (LA-ICP-MS), scanning electron microscopy coupled with an X-ray energy dispersive spectrometer (SEM-EDS), laser confocal Raman spectrometer (LRS), and high-resolution time of flight-secondary ion mass spectrometry (ToF-SIMS). The results show that the main crystal phase in the glaze is the same as that of the Longquanwu Kiln in the Liao and Jin Dynasty, which is anorthite and augite. The overall performance of the glaze is that the sauce-black glaze matrix is rich in iron (Fe2O3 mean 9.73%) and the mineral crystal is rich in iron (Fe2O3 mean 11.33%). In addition to α-Fe2O3 crystals, Fe3O4 crystals and other recrystallized minerals after melting, the glaze also has pleonaste, residual kaolinite and other unmelted minerals from raw glaze materials. The residual kaolinite shows that the firing temperature of the samples in this study was most likely below 1200℃. The BRIEF REPORT is available for this paper at http://www.ykcs.ac.cn/en/article/doi/10.15898/j.ykcs.202401290011.
-
Keywords:
- tea-dust glaze /
- minerals /
- element imaging /
- ToF-SIMS /
- LA-ICP-MS
BRIEF REPORTSignificance: Modern scientific research on ancient ceramics encompasses numerous aspects, such as the mineral crystal characteristics of the glaze[2], the color mechanism of the glaze[3], the ancient firing process and raw materials[5], and the reproduction and restoration of ancient ceramics[6]. The utilization of modern cutting-edge analytical instruments to conduct in-depth and detailed research on ancient ceramics, such as tea-dust porcelain, can enhance the understanding of the production process, color mechanism, layered structure and other aspects of ancient ceramics. It cannot only offer methods, principles, research data and other supports for the imitation and restoration, identification, protection and restoration of ancient ceramics, but also promote and inherit the outstanding ancient porcelain culture and advance the progress of related intangible cultural heritage.
As one of the earliest crystallized glazes, to date, 12 samples of tea-dust glaze from ancient kilns have been systematically investigated, including the Huangbao Kiln in the Tang Dynasty, the Hunyuan Kiln, the Guantai Kiln and the Longquanwu Kiln in the Liao and Jin Dynasties[7-9]. With the deepening of research on ancient ceramics, the importance of minerals has become increasingly prominent, but there is still a lack of directional classification of minerals in this field. At the same time, the majority of the scientific instruments employed have been phased out, and more experimental analysis and data support are urgently needed to establish a more comprehensive database of tea-dust glaze characteristics.
In this research, tea-dust glaze pieces of the Ding Kiln in the Northern Song Dynasty were studied by LA-ICP-MS, ToF-SIMS, SEM-EDS and LRS. Drawing on the mineral crystallization and weathering processes of igneous rocks and previous mineral related research results, for the first time, mineral crystals in ceramic glazes were classified into three categories based on their genesis system: post melting recrystallized minerals, unmelted minerals, and weathering minerals. The different classification minerals were revealed to have different indicative meanings for ceramic research. The tea-dust glaze belonged to the iron system of crystallization glaze, which was manifested as tan mineral crystals and sauce-black glaze matrix rich in iron. The residual kaolinite of glazed raw materials shows that the firing temperature of the sample was most likely below 1200℃, which was different from the current view that the tea-dust glaze of Tang and Song such as the Yaozhou Kiln belonged to high-temperature glaze.
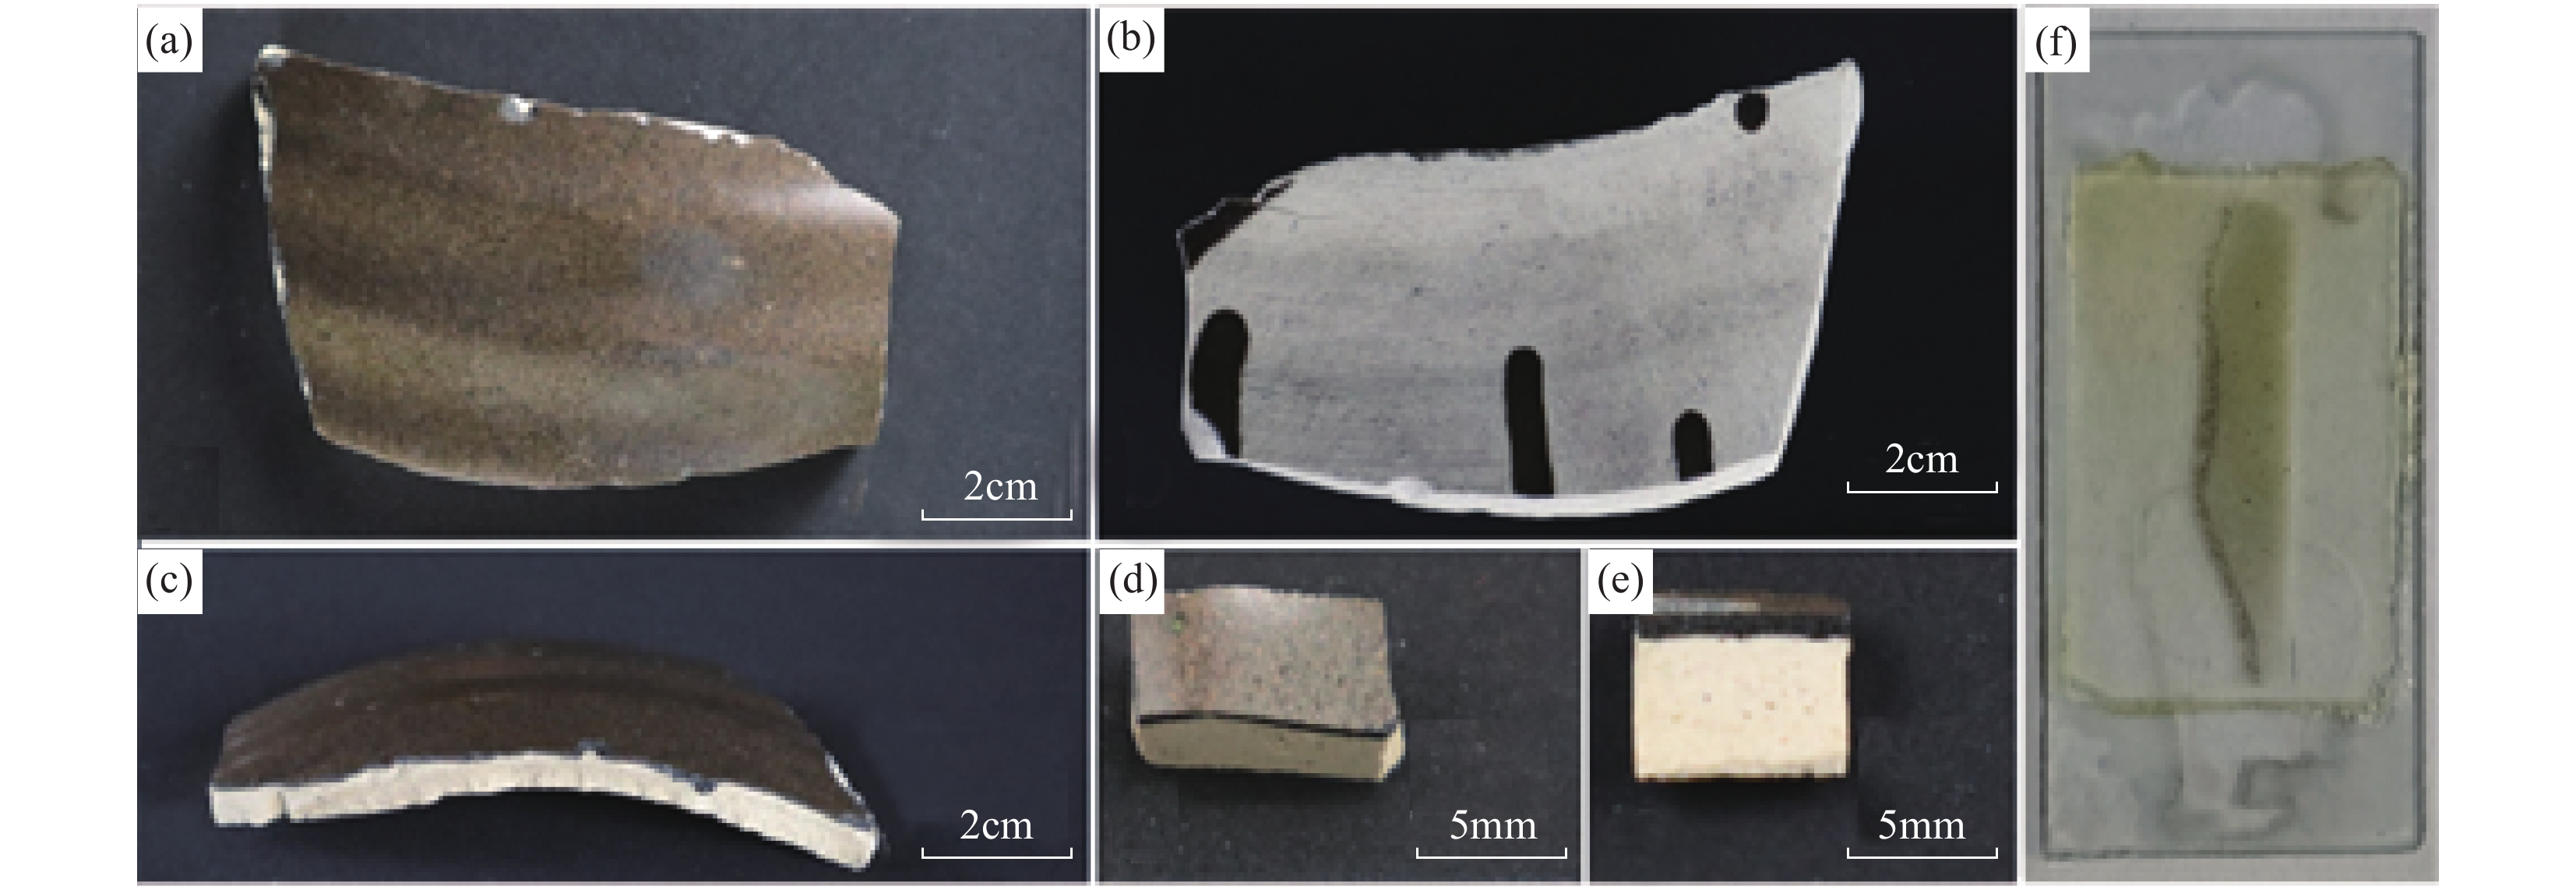
Methods: (1) Sample information. The sample is the waist fragment of a pot from the Ding Kiln of the Northern Song Dynasty. The exterior is coated with tea glaze (Fig.1a), while the interior is unglazed (Fig.1b). The body, approximately 5mm thick and white in color (Fig.1c), exhibits distinct spots of rust and other colors (Fig.1e). This is in accordance with the fundamental characteristics of direct tire production by Dingyao, using weathered coal gangue (white dirt) as a raw material[31]. The cross section of the glaze layer, approximately 1mm thick, presents a sauce-black glaze matrix (Fig.1e). A 1.5cm×1.5cm rectangular block was fabricated by cutting the sample fragments and thinned to a thickness of 0.5cm, while the original glaze was retained as test sample A (Fig.1d). Another 1.5cm×1.5cm rectangular block was produced and beveled at an angle of approximately 60° from the normal of the enamel surface to “extend” the matrix of the measured glaze, and then polished as test sample B (Fig.1e). Additionally, a 3cm×0.5cm rectangular block was made to smooth the tire base and the section was fabricated into an optical slice (Fig.1f).
(2) LA-ICP-MS analyses. LA-ICP-MS consists of a 193nm deep ultraviolet laser denudation system (Applied Spectra’s Resolution SE) and an inductively coupled plasma mass spectrometer (Agilent’s Agilent 7900). Laser parameters are set as follows: spot diameter 50μm, denudation frequency 10Hz, energy density 3.5J/cm, scanning speed 3μm/s. Detailed equipment tuning parameters can be found in Thompson et al[32]. NIST610, NIST612, BCR-2G and BHVO-2G were used as standard samples, and the standard sample was inserted after every 10 sample points for analysis. The data were corrected by the “3D Trace Element” method using Iolite software without an internal standard method, and the valence state of iron was bivalent.
(3) ToF-SIMS analyses. ToF-SIMS (TOF SIMS 5-100, ION-TOF GmbH, Germany) was set with a cycle time of 100μm (0−1000amu). A sputtering gun was used to remove sample surface contamination, and an electron gun (±20keV) was used to neutralize the charge effect on the sample surface. Spe mode parameters: an ion beam Bi1+, energy 30keV, beam (pulsed) 0.8pA; fast mode parameters: an ion beam Bi1+, energy 30keV, beam (pulsing) 1.0pA. Sputtering parameters: the sputtering gun chooses Arn+ cluster ions to avoid surface oxidation caused by the sputtering beam, with an energy of 10keV and a beam current of about 9nA. SurfaceLab 7.2 software was used to correct and analyze the ToF-SIMS experimental data.
(4) SEM-EDS analyses. Before the use of SEM-EDS (Phenom ProX), the sample glaze was wiped and cleaned with analytical grade ethanol, and then sprayed with platinum. The accelerated voltage was 15kV and the electron beam current was 0.6nA.
(5) LRS analyses. Mineral phase identification was completed by using LRS (HORIBA XploRA Plus). The test point was selected under a high-magnification objective (×100). The laser wavelength was 638nm, the laser power was 25mW, the spot diameter was 1μm, the scanning range was 100−1800cm−1, and the exposure time was 10-100s. Each location was scanned twice.
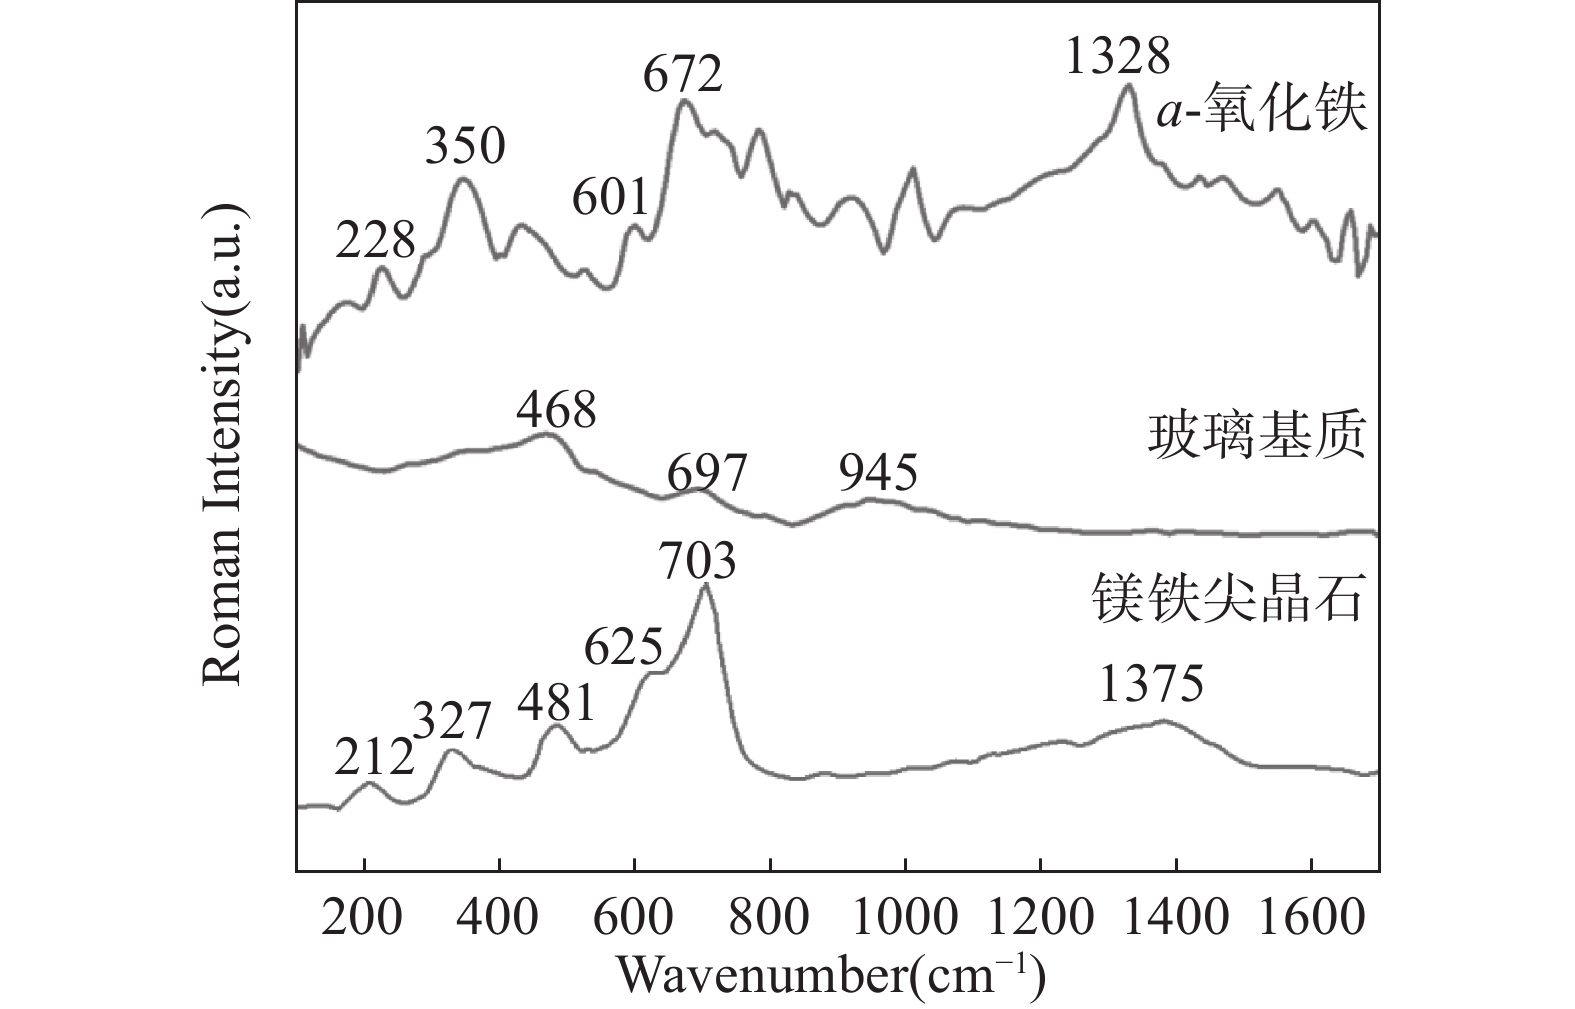
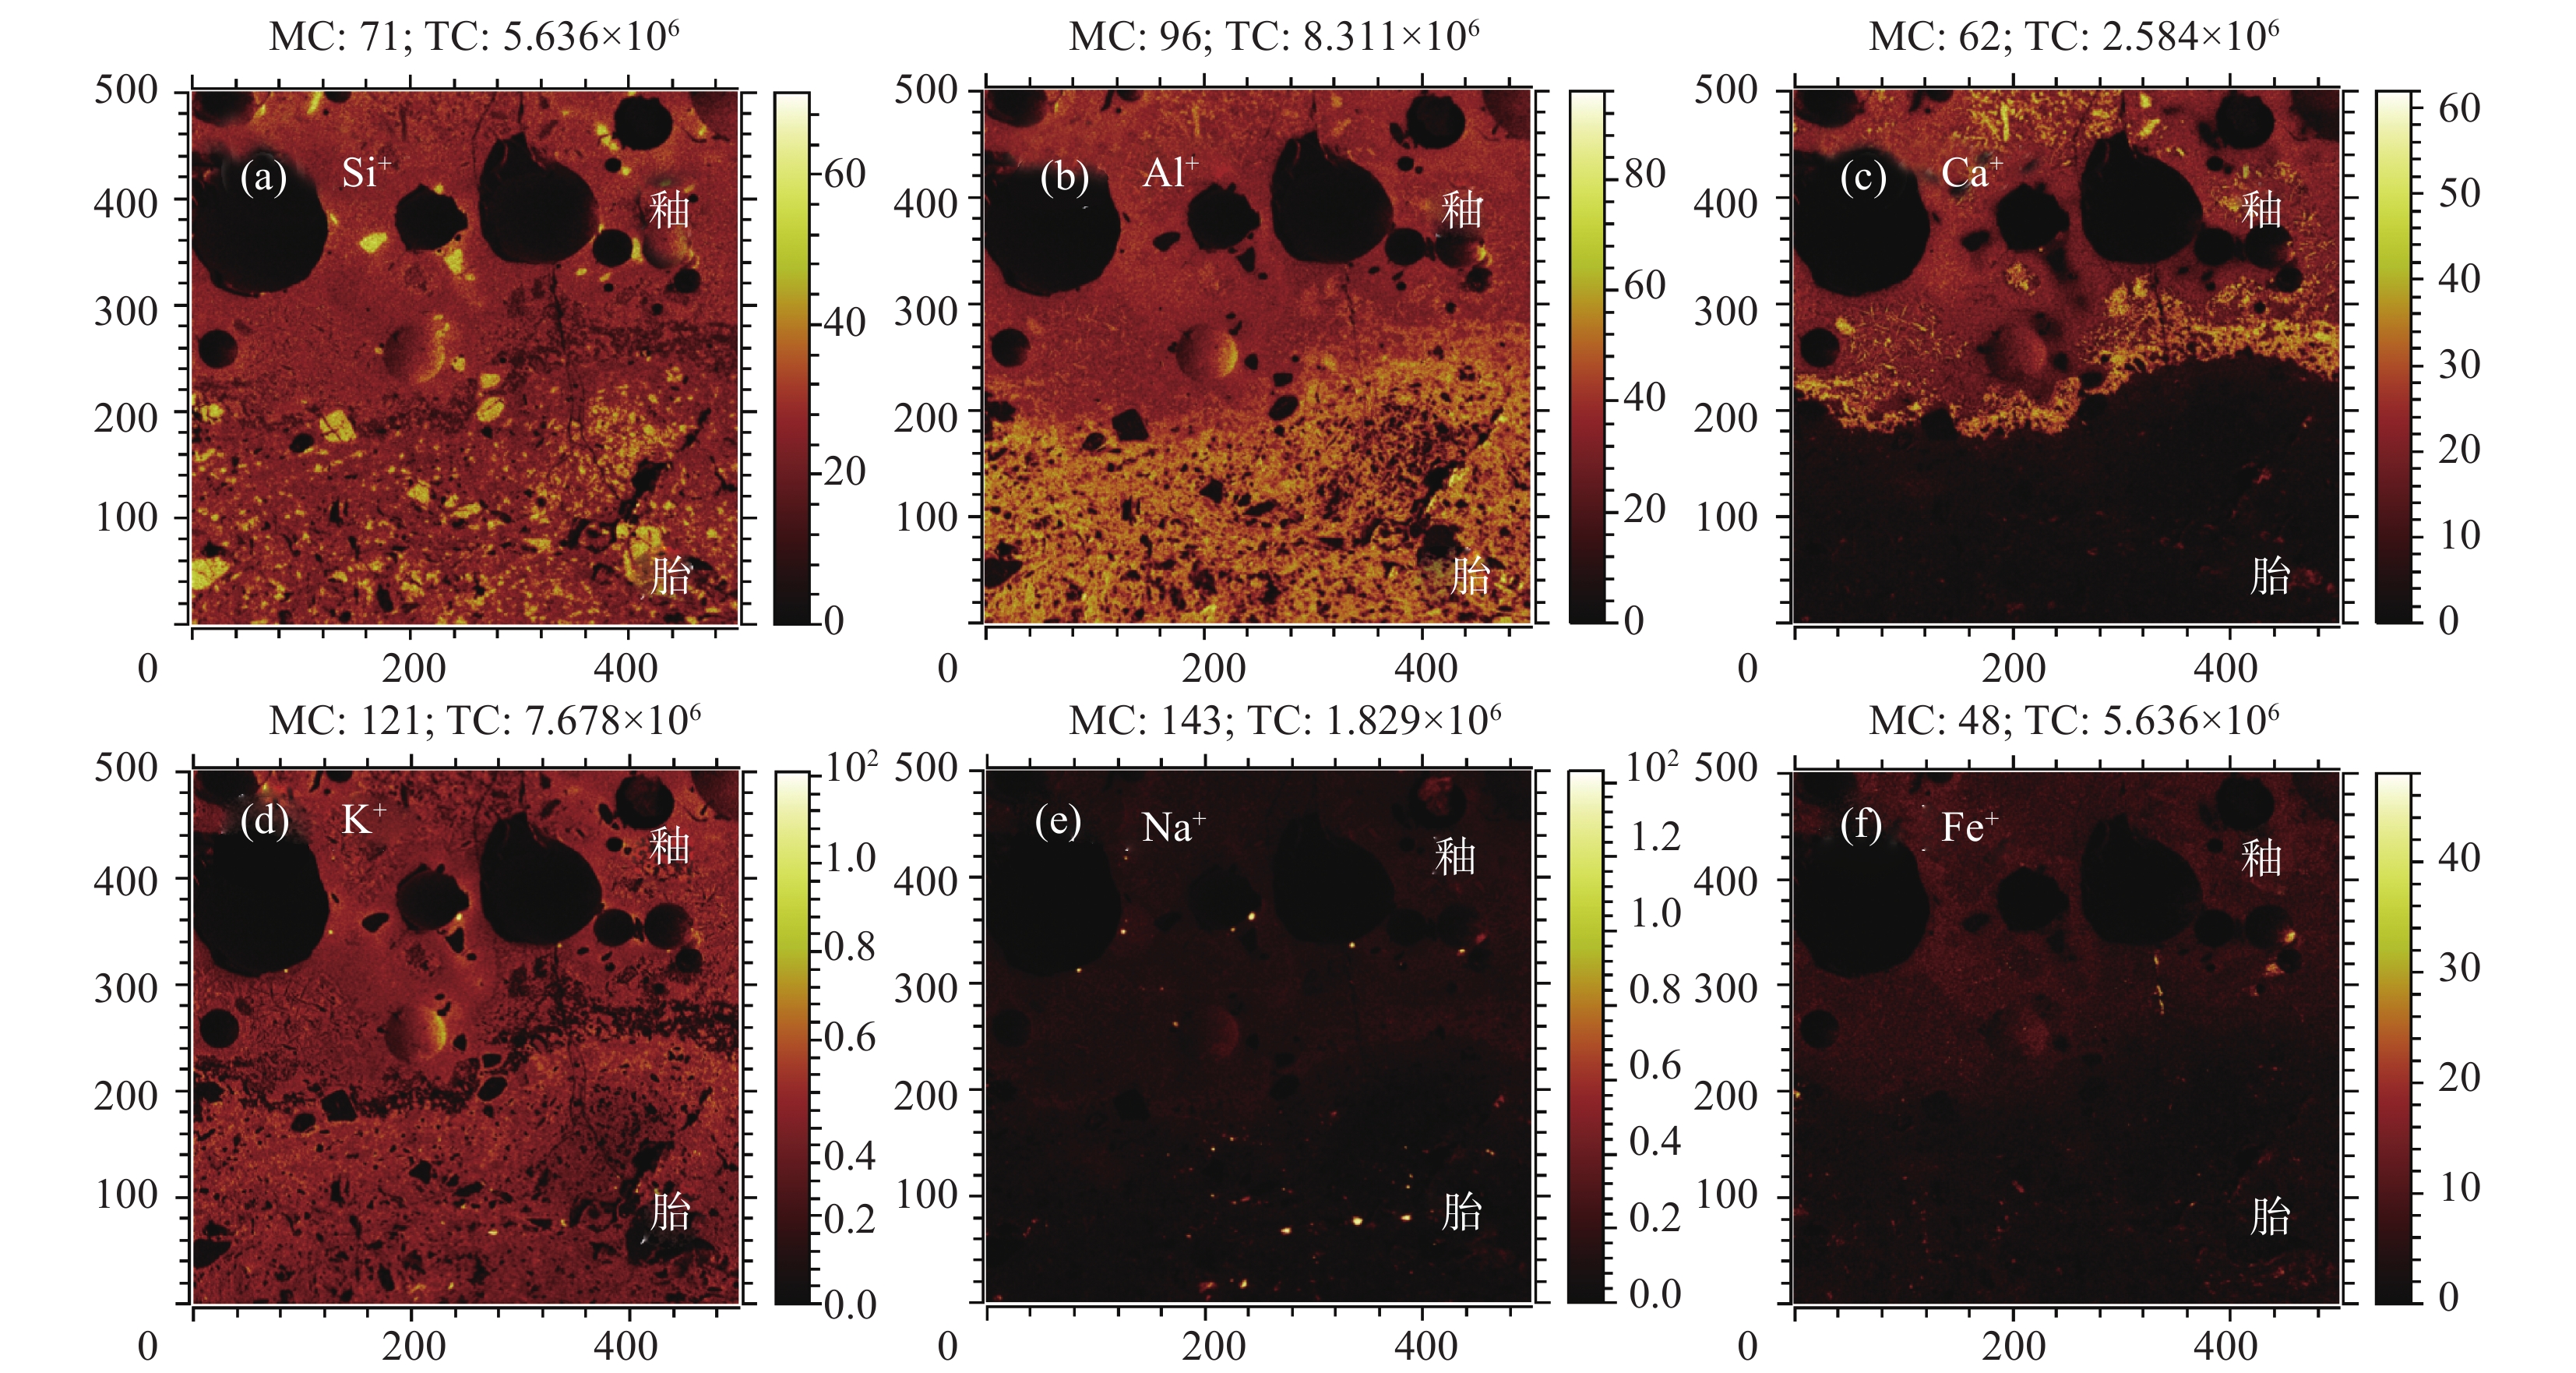
Data and Results: The sample is of a high calcium glaze (CaO content>10%), and also an iron crystalline glaze. The overall performance of the glaze matrix is a sauce-black iron-enriched (Fe2O3 content mean of 9.73%) and yellow-brown mineral crystal iron-enriched (Fe2O3 content mean of 11.33%). The mineral clusters can be classified into three types based on their elemental composition and morphological characteristics. The main crystalline minerals are anorthite and augite formed through recrystallization after melting, which are consistent with those of the Longquanwu Kiln in the Liao and Jin Dynasties. The Raman spectra of α-Fe2O3 crystals precipitated by saturated iron elements are in accordance with those of the black glaze Huabei oil in the Song Dynasty and the Linfen Kiln in Shanxi[30,37]. Residual kaolinite as an unmelted mineral was detected in the glaze, which indicates that the sintering temperature is lower than 1200℃. SIMS ion imaging indicated that Fe was not uniformly enriched near the glaze bubble, and there was a 20−80μm thick anorthite crystal layer at the fetal glaze junction, rather than a dense reaction layer in the makeup clay or glass state.
-
土地质量调查中测定土壤中的有效磷含量能够准确了解当前土壤供磷状况,对指导改良土壤、农业生产、国土生态环境修复等具有重要意义[1-3]。研究者普遍认为土壤中磷的存在形式复杂,不同溶解度差异较大,此外有效磷又是植物生长所必需的关键养分之一,但由于在土壤中的存在形式复杂,使其成为最难被准确提取的养分之一[4]。1894年Dyer[5]首次用2%乙酸从土壤中提取植物中可利用磷。此后,基于土壤磷分布的多样性,研究者开发了多种提取方法,例如Olsen 等[6]用碳酸氢钠弱碱性溶液浸提土壤中的有效磷,在中性和碱性土壤中效果良好。但随着研究深入,协调不同土壤元素的形态、有效态的测试分析越来越受到研究人员的重视,以便更好地指导农业施肥、科学研究和控制环境污染[7-8]。通过持续改进用氟化铵-盐酸溶液浸提酸性土壤中有效磷的方法[9],以及Turner等[10]评估了多种浸提剂在提取土壤有机磷(SOP)的效率,发现不同浸提剂对无机磷和有机磷的提取效率存在显著差异,而且有机质含量高与无机磷含量高的土壤对浸提剂的响应不同。这些分析方法的改进促进了在研究溶解不溶性钙磷酸盐(Ca-P)化合物浸提剂方面的发展。
上述前人研究表明,土壤中磷的复杂形态及其在土壤中的吸附、固定和释放过程,使得有效磷的准确测定面临着难点和挑战,有必要对现有方法进行改进,开发一些更具广泛适用性的浸提剂用于测定土壤中的有效磷和其他有益元素。在方法研究方面,林业标准《森林土壤磷的测定》(LY/T 1232—2015)增加了用电感耦合等离子体发射光谱法(ICP-OES)测定森林土壤有效磷的方法[11-13],不仅能克服腐植酸颜色带来的影响,而且该技术的应用逐渐展示了更高的测量精度和稳定性,但目前对土壤样品的前处理和分析条件仍有待优化。离子液体作为一种新型浸提剂,在测定土壤中有效磷方面具有一定的潜力,但缺少系统的实验研究,目前离子液体的设计和选择可以针对土壤样品的一些特性和磷的形态进行调整,以提高选择性和提取效率,但应用于实际分析还需进行大量试验[14]。氢氧化钠溶液能够有效地溶解酸性土壤中的铁磷酸盐,而柠檬酸钠、连二硫酸钠和氢氧化钠组合的浸提剂则更适合提取闭蓄态磷[15-16]。对于石灰性土壤中不同形态的钙磷酸盐(Ca-P),蒋柏藩等[17]按照溶解度和有效性又分为三级,即用0.25mol/L碳酸氢钠提取磷酸二钙型(Ca2-P),用1mol/L乙酸铵提取磷酸八钙型(Ca8-P),用0.5mol/L硫酸提取磷石灰型(Ca10-P),此外用0.1mol/L氢氧化钠-碳酸钠溶液提取了铁磷酸盐(Fe-P)。十六烷基三甲基铵溶液是一种阳离子表面活性剂,其良好的溶解度和表面活性使之在污水处理、药物传递和纳米材料制备等领域具有重要应用,而应用于提取土壤中的有益元素亟待开展研究。
本文将氢氧化钠(NaOH)和十六烷基三甲基铵(CTA)作为一种碱系离子液体混合浸提剂,研究该浸提剂提取土壤中有效磷的分析方法。结合ICP-OES精密度高、检出限低、线性动态范围宽、干扰小等优点[18],对测定碱性土壤有效磷的不同实验条件如分析谱线、水土比、盐酸溶液酸化和滤液静置时间等因素进行实验[19],探索复合碱系离子液体浸提碱性土壤中的有效磷,从而建立一种适合碱性土壤中有效磷的分析方法。
1. 实验部分
1.1 仪器和主要试剂
电感耦合等离子体发射光谱仪(iCAP6300,美国ThermoFisher公司)。仪器主要工作条件为:射频发生器总功率1150W,振荡频率27.12MHz,辅助气(Ar)流速0.5~1.0L/min,积分时间8s,观测高度15mm。
智能恒温培养振荡器(UP-211C,速率150~180r/min,上海优普实业有限公司);雷磁酸度计(PHS-3C,上海仪电科学仪器股份有限公司);电子天平(0.0001g)。
磷标准溶液:称取105℃烘干2h的磷酸二氢钾(优级纯) 0.4394g,用高纯水溶解后,定容至1L,摇匀。即为磷标准溶液(100mg/L)。
十六烷基三甲基铵(CTA)溶液:称取182.225g CTA(优级纯),加入适量的去离子水,充分溶解,将溶解后的十六烷基三甲基铵溶液转移至1L容量瓶中,并用去离子水加至刻度线,摇匀混合,储存于聚乙烯瓶中备用。
氢氧化钠溶液(0.5mol/L):称取约20.0g氢氧化钠(优级纯)固体,用高纯水溶解后,定容至1L,摇匀。
盐酸溶液(1.0mol/L):量取82.0mL浓盐酸(优级纯),用高纯水稀释后,定容至1L,摇匀。
1.2 样品和实验方法
实验样品选择中国主要土壤类型的代表性区域的耕作层土壤:河北潮土(NSA-2)、陕西黄绵土(NSA-3)、四川紫色土(NSA-4),以及国家农业土壤一级标准物质:陕西渭南塿土(GBW07493)、陕西洛川黑垆土(GBW07494)、宁夏吴忠灌於土(GBW07495)、甘肃武威灌漠土(GBW07496)、青海互助栗钙土(GBW07497)、新疆阿克苏棕漠土(GBW07498)。样品的pH值和有机质含量基本属性见表1。
表 1 样品基本属性Table 1. Basic properties of the samples标准物质编号 有效磷含量推荐值
(mg/kg)pH
(25℃)有机质含量
(%)标准物质编号 有效磷含量推荐值
(mg/kg)pH
(25℃)有机质含量
(%)NSA-2 36±6 8.0 1.68 GBW07494 21±2 8.3 9.90 NSA-3 13±3 8.3 1.19 GBW07495 98±6 8.3 12.5 NSA-4 14.5±2.6 7.5 1.13 GBW07496 44±6 8.5 17.1 NSA-5 4±1 5.9 3.76 GBW07497 49±7 8.3 26.1 GBW07493 32±3 8.4 15.6 GBW07498 44±5 8.6 9.40 准确称取2.5g(精确至0.0001g)通过2mm孔筛的风干碱性土壤样置于塑料浸提瓶中,加入0.5mol/L 氢氧化钠−0.5mol/L十六烷基三甲基铵混合浸提剂50.00mL,在恒温(25±1℃)往复式振荡器中振荡30min(时间需严格控制)。用无磷中速滤纸干过滤到10mL比色管中,取上清液5mL加入5mL 1.0mol/L盐酸酸化,静置待测。同时按照上述步骤制备全程序空白样品。
将制备好的试样溶液用ICP-OES测定有效磷含量,采用标准曲线法定量。在仪器软件中输入土壤称样量和定容体积、稀释倍数等参数,通过测定试样中磷元素的发射强度,由标准曲线直接计算出土壤有效磷的含量。有效磷含量以干基表示,需要校正含水率,校正公式见式(1):
$$ \mathit{w} _{ \mathrm{P}} \mathrm= \mathit{X} \mathrm{/} \mathit{k} $$ (1) 式中:wP—有效磷含量(mg/kg);X—仪器测量信号所转换成相应的磷含量(mg/kg);k—由风干土壤换算成烘干土样的水分换算系数。
2. 结果与讨论
2.1 校准曲线和背景扣除
ICP-OES测定有效磷时,背景扣除是非常重要的步骤,它可以消除背景信号对测量结果的干扰,提高准确性。对于不同的样品类型和测量条件,背景扣除的参数需要进行优化。这包括空白校正中的空白样品选择、背景区域的选择、背景扣除算法的参数设置等[20]。而且在此之前,需要确保背景信号相对稳定,通过连续测量空白样品或参考样品来监测背景信号的变化情况,以确保背景扣除的准确性,可以选择与待测元素具有相似化学性质的材料作为参考材料。此外,适当的分析谱线能够有效地避免谱线造成的重叠干扰,而通过背景校正减小背景干扰也是提高测量精度的有效方式。如果不进行背景校正,则在每个峰值中心位置确定的原强度被用于计算浓度,较高的峰值比未受影响的峰值获得较高的分析结果。在选择背景位置时,应遵循的原则[21]是:将背景位置定在尽可能平坦、无小峰且离谱峰足够远的地方,此外,左、右背景强度的平均值尽可能与谱峰背景强度一致。
实际分析测试中背景校正如图1所示,有效磷测试时参考校准曲线扣除背景时测量结果的原始积分曲线(该数据来源于仪器iCAP6300电感耦合等离子体发射光谱仪,实验条件为:射频发生器总功率1150W,振荡频率27.12MHz,雾化器气体压力145kPa,辅助气(Ar)流速0.5L/min,冷却气(Ar)流速1.4L/min,蠕动泵转速100r/min,积分时间8s,观测高度15mm,环境温度24.6℃,湿度37%),图中的曲线表示了不同浓度含量的P谱峰曲线,在P 213.618nm和P 214.914nm波长下,有效磷测定的谱图峰型良好,并且积分和背景扣除合理。参考图1的背景校正结果,可以进一步优化测定碱性土壤有效磷的背景扣除方法,从而提升测量的准确性和可靠性。
![]() 图 1 磷标准系列(a) P 213.618nm和(b) P 214.914nm波谱扣背景图图中C-C表示选择的积分区域;L-L表示左侧背景扣除区域;R-R表示右侧背景扣除区域。Figure 1. The phosphorous spectral background deducted standard series of (a) P 213.618nm and (b) P 214.914nm
图 1 磷标准系列(a) P 213.618nm和(b) P 214.914nm波谱扣背景图图中C-C表示选择的积分区域;L-L表示左侧背景扣除区域;R-R表示右侧背景扣除区域。Figure 1. The phosphorous spectral background deducted standard series of (a) P 213.618nm and (b) P 214.914nm2.2 磷分析谱线的选择
测定有效磷含量时,选择合适的分析谱线是至关重要的,因为它直接影响到测定结果的准确性和可靠性。ICP-OES分析中,磷有177.495nm、178.211nm、213.618nm、214.914nm四个波长谱线,均处于真空紫外区。虽然P 177.495nm、P 178.211nm谱线灵敏度高,但是很容易受到空气介质对谱线的吸收影响,其抗干扰能力差。马兴娟等[22]在测定石灰性土壤中有效磷含量时,选定波长P 213.618nm取得良好的效果。而另外有研究表明213.618nm和214.914nm是测定磷元素的主要参考谱线[23],考虑到使用的光谱仪的分辨率和灵敏度等特性,本研究选择P 213.618nm和P 214.914nm作为磷元素的分析线波长。
将含量0.00、2.00、5.00、10.00、20.00、50.00的磷标准系列溶液,按照ICP-OES设定的条件进行测定。以磷浓度为横坐标,发射强度为纵坐标绘制校准曲线,结果表明:磷的质量浓度在50.00mg/kg以内与发射强度呈线性关系。对12份空白溶液进行测定,以其测定值标准偏差的3倍对应样品的质量分数作为方法检出限。线性回归方程:Y1=207.98X1−29.32(P 213.618nm);Y2=128.78X2−23.95(P 214.914nm),两个波长的待测磷元素工作曲线线性较好,其相关系数在0.999852~0.999861,方法检出限分别为0.054mg/kg和0.066mg/kg。选择P 213.618nm谱线,检出限更低,可以满足碱性土壤样品中有效磷测试需求。
选择不同的磷谱线测定有效磷,其3次测定结果平均值见表2。可知NSA系列和GBW07493、GBW07494、GBW07496~GBW07498土壤标准物质波长P 213.618nm对应的测定结果与推荐值相吻合,而新疆阿克苏棕漠土(GBW07498)是波长P 214.914nm对应的测定结果较好。但是结合校准曲线斜率和相应检出限,有效磷P 213.618nm谱线的灵敏度高,抗干扰能力强,多数土壤标准物质的测定结果接近推荐值。所以在土壤有效磷实际分析时,推荐选择P 213.618nm谱线,而选择P 214.914nm时需要对分析结果进行校准。
表 2 不同磷分析谱线测定样品有效磷含量结果对比Table 2. Comparison of analytical results of the effective phosphorus content in samples by different phosphorus analysis lines样品编号 有效磷含量
(P 213.618nm)
测定值
(mg/kg)有效磷含量
(P 214.914nm)
测定值
(mg/kg)有效磷含量
推荐值
(mg/kg)NSA-2 36.13 39.70 36±6 NSA-3 12.43 14.00 13±3 NSA-4 15.24 16.83 14.5±2.6 NSA-5 3.96 4.29 4±1 GBW07493 33.11 38.63 32±3 GBW07494 22.74 25.97 21±2 GBW07496 44.73 54.77 44±6 GBW07497 48.63 57.67 49±7 GBW07498 36.37 43.36 44±5 2.3 混合浸提剂水土比优化实验
林业标准《森林土壤磷的测定》(LY/T 1232—2015)推荐的浸提条件是:温度控制在20~25℃恒温条件,振荡速度160r/min,振荡时间30min;而农业标准《土壤检测 第7部分:土壤有效磷的测定》(NY/T 1121.7—2014)推荐浸提条件是:温度控制在25±1℃的条件下,振荡速度180±20r/min,振荡时间30min。但是文献研究[24]表明温度对碱性土壤有效磷的影响比酸性土壤影响大,对于同一土壤,在不同季节、不同温度条件下所测结果不同。结合态的Al-P、Fe-P盐随着温度升高,会促进其水解释放出磷,有效磷含量随着提取温度的升高而增加[25-26]。所以在测量方法研究中,严格控制温度在25±1℃,能稳定浸提效果。
水土比是指浸提液与土壤样品的质量之比。不同水土比对土壤有效磷测定的影响主要体现在土壤样品中溶解磷的提取效率,当基本实验条件确定后,本文研究测定不同水土比对土壤有效磷测定的影响。可知水土比对农业土壤标物质陕西黄绵土(NSA-3)和黄土土壤陕西渭南塿土(GBW07493)影响不大,水土比10∶1和20∶1结果基本一致,测定值与推荐值偏差不大(表3)。两组测量结果均符合生态地球化学评价样品分析技术要求(DD2005-03)中有效磷分析相对偏差允许误差限(小于10%)。其他6组土壤试验均是水土比10∶1时测定结果接近推荐值。但是结合浸提剂的用量和节约成本,水土比10∶1均可满足测试时质量控制的要求。
表 3 不同水土比条件对有效磷含量测定结果的影响Table 3. Effect of different water-soil ratios on the determination of available phosphorus content样品编号 水土比 有效磷含量(mg/kg) P 213.618nm测定值 推荐值 NSA-2 10∶1 36.40 36±6 20∶1 44.63 NSA-3 10∶1 12.09 13±3 20∶1 12.48 NSA-4 10∶1 15.23 14.5±2.6 20∶1 18.39 NSA-5 10∶1 3.986 4±1 20∶1 5.855 GBW07493 10∶1 29.95 32±3 20∶1 34.54 GBW07494 10∶1 23.38 21±2 20∶1 27.27 GBW07496 10∶1 44.84 44±6 20∶1 53.27 GBW07497 10∶1 55.07 49±7 20∶1 65.37 GBW07498 10∶1 36.54 44±5 20∶1 44.62 大量研究也表明[27-28]:对于不同类型的土壤样品,可能存在最佳的水土比,即可最大程度地提取土壤中的有效磷而不引入过多的稀释效应。因此,在土壤有效磷含量测定时,应该针对具体的样品类型进行优化水土比的选择,这样可以提高溶解磷的提取效率,从而获得准确和可靠的测定结果。分析表3中黄土壤新疆阿克苏棕漠土(GBW07498,水土比20∶1)的测试结果,其中钙和镁的含量(Ca2+ 8.8g/kg,Mg2+ 636mg/kg)是同类型其他5组土壤标准物质中钙和镁含量平均值的32倍和14倍,这就使得浸提时磷更容易与钙、镁形成难溶性化合物,如磷酸三钙[Ca3(PO4)2]和羟磷灰石[Ca5(PO4)3OH]等。因此传统的磷浸提剂如盐酸、氟化铵等在高钙、镁含量土壤中的溶解和提取效率不佳,需使用能够破坏这些磷酸钙、磷酸镁化合物的强力浸提剂(NaOH+CTA混合浸提剂),同时提高水土比(20∶1)干扰钙、镁等离子在溶液中与磷酸根离子的竞争力,从而获得更准确的测定结果。
2.4 盐酸酸化对有效磷测定的影响
周向飞等[29]最近研究了使用不同浓度的盐酸溶液酸化提取液后对土壤有效磷测量结果的影响,提出用盐酸(50%)酸化后测定碱性土壤中有效磷。与其不同的是,本研究碱性土壤用1.0mol/L盐酸酸化后再测定有效磷。通过表4数据分析可知:对于有效磷含量高的碱性土壤,盐酸酸化后对测定结果影响较大,与推荐值偏差明显减小,而对有效磷含量偏低的土壤影响不大。这说明测定有效磷含量高的碱性土壤时,使用盐酸酸化处理会导致溶液中盐分的增加,但其实不同浓度的盐酸加入最终有助于稀释整体溶液盐分,降低溶液的电导率和离子强度,减少了对ICP-OES测定的影响,测定结果稳定性好。
表 4 盐酸酸化对有效磷含量测定结果的影响Table 4. Effect of hydrochloric acid acidification on the determination of available phosphorus content样品编号 加1.0mol/L盐酸
有效磷测定值(mg/kg)不加1.0mol/L 盐酸
有效磷测定值(mg/kg)有效磷含量
推荐值(mg/kg)NSA-2 36.09 35.85 36±6 NSA-3 12.53 12.44 13±3 NSA-4 15.47 15.25 14.5±2.6 GBW07493 36.40 43.48 32±3 GBW07494 24.64 28.28 21±2 GBW07496 44.03 52.08 44±6 GBW07497 53.59 61.78 49±7 通过试验研究结果表明:测定碱性土壤有效磷含量高(>10mg/kg)的样品时,样品1.0mol/L盐酸溶液酸化有助于提高准确度。表5是进一步验证盐酸酸化后对有效磷测试结果的影响,实验结果表明单次测量的最大相对偏差均小于10%,满足中国地质调查局地质调查技术标准(DD2005-03)有效磷测试分析相对偏差允许限。所以对于相对高含量有效磷样品的分析,用1.0mol/L盐酸酸化有助于提高方法的精密度。
表 5 高有效磷含量样品用盐酸酸化处理后的测试结果Table 5. Analytical results of samples with high available phosphorus content after acidification with hydrochloric acid solution.样品编号 有效磷含量测定值(mg/kg) 有效磷含量测定
平均值(mg/kg)最大相对偏差
(%)ΔlogC NSA-2 36.97 36.73 35.91 37.07 37.85 36.52 36.57 36.29 36.70 3.13 −0.01 GBW07494 22.70 21.82 21.93 22.36 21.09 22.10 21.10 20.45 21.69 5.72 −0.01 GBW07495 100.5 102.9 101.7 103.3 102.6 98.71 99.29 100.4 101.2 2.11 −0.02 GBW07496 49.24 50.03 48.65 48.26 50.77 48.58 48.00 48.72 49.03 3.55 −0.05 GBW07497 55.38 53.50 51.19 50.45 46.80 50.77 50.26 52.47 51.35 8.86 −0.02 GBW07498 39.02 39.04 42.13 43.29 41.07 43.52 43.64 40.71 41.30 5.67 0.03 注:相对偏差=(测定值−平均值)/平均值×100%。 2.5 滤液静置时间对有效磷测定的影响
离心机快速分离滤液后将滤液静置时间对土壤中有效磷测定的影响进行实验。实验结果如图2所示,随着滤液静置时间的延长,碱性土壤中有效磷的测量结果呈缓慢下降趋势,可以推测待测离子可能形成一些大的络合物沉淀或吸附在容器壁上,减小了溶液中待测离子的浓度。虽然NSA-3和GBW07494有效磷的测定结果有较大波动,但是整体下降趋势不变。这是因为在阳离子表面活性剂CTA存在的情况下,土壤中的有机质和矿物质可能继续吸附或释放磷改变滤液中磷的浓度,导致滤液中有效磷含量变化较大[30-31]。图2。从实验结果可以看出,当过滤效果好且滤液的澄清度高时,推荐滤液静置时间应控制在合理范围内(0~5h)完成样品测量工作,以确保测定结果的可重复性和准确性。
![]() 图 2 滤液静置时间对有效磷含量测定结果的影响Figure 2. Effects of filtrate standing time on determination of available phosphorus content
图 2 滤液静置时间对有效磷含量测定结果的影响Figure 2. Effects of filtrate standing time on determination of available phosphorus content2.6 方法准确度和精密度
准确称取国家农业土壤标准物质试验样品各12份,按照本文方法实验条件进行处理,在最佳化条件下平行分析12次,分别计算每个标准物质12次平行测定的相对标准偏差(RSD)来衡量方法的精密度,从测定结果(表6),精密度(RSD)为0.93%~3.87%,结合表5测定结果满足生态地球化学评价样品分析中有效磷测定的方法要求。表明氢氧化物系离子液体浸提碱性土壤有效磷时,实验条件经优化后效果良好,能够满足土壤有效磷分析需求[32]。
表 6 土壤有效态标准物质样品有效磷含量12次测定结果Table 6. Results of 12 determinations of available phosphorus in soil available standard substance samples实验次数 NSA-2
(mg/kg)NSA-3
(mg/kg)NSA-4
(mg/kg)NSA-5
(mg/kg)GBW07493
(mg/kg)GBW07494
(mg/kg)GBW07496
(mg/kg)GBW07497
(mg/kg)GBW07498
(mg/kg)1 34.02 12.09 15.23 4.114 35.54 24.64 40.06 52.95 39.25 2 34.51 12.53 15.47 4.048 38.20 23.89 40.33 54.65 40.67 3 34.45 12.59 15.10 4.116 39.19 24.67 40.19 56.23 39.96 4 35.85 12.66 15.22 3.992 38.23 25.15 42.08 52.18 37.13 5 35.89 12.33 15.26 4.131 37.62 25.58 42.83 51.34 36.02 6 35.97 12.31 15.24 3.926 38.09 25.67 44.03 52.11 39.53 7 35.90 13.01 15.25 3.946 36.40 24.62 44.00 54.30 37.76 8 36.40 12.48 15.44 4.041 39.09 23.75 43.54 52.96 36.68 9 36.09 12.56 14.95 3.925 40.32 23.93 41.53 54.10 37.88 10 35.90 13.19 15.09 4.067 38.89 24.23 41.34 50.21 37.81 11 36.40 12.88 15.24 4.054 38.54 25.40 43.90 51.40 39.97 12 36.09 12.56 15.24 4.101 39.20 24.66 42.45 54.69 39.53 平均值 35.62 12.60 15.23 4.04 38.28 24.68 42.19 53.09 38.52 s 0.810 0.307 0.141 0.061 1.30 0.660 1.51 1.74 1.49 RSD(%) 2.26 2.44 0.93 1.51 3.38 2.67 3.58 3.28 3.87 推荐值 36 13 14.5 4 32 21 44 49 44 ΔlogC −0.005 −0.014 0.021 0.004 0.078 0.071 −0.018 0.035 −0.058 3. 结论
研究了氢氧化钠与十六烷基三甲基铵(CTA)混合浸提剂在测定碱性土壤中有效磷含量方面的应用。采用ICP-OES测定土壤中有效磷具有更高的灵敏度、准确性和精密度。通过优化水土比、盐酸溶液酸化处理和滤液静置时间等实验条件,结果表明混合浸提剂能显著提高碱性土壤中有效磷的提取效率,其中阳离子表面活性剂CTA的加入提高了有效磷的溶解度和提取率,从而为碱性土壤中有效磷的测定提供了一种可靠的分析方法,为土壤磷元素分析方法的改进和新型浸提剂的开发提供了基础数据和技术支持。
相比于传统浸提剂,混合浸提剂不仅克服了浸提效率低、测定结果不稳定的问题,而且通过优化实验参数,实现了更高的精度和稳定性。然而氢氧化物系离子液体浸提剂在不同类型土壤样品中的适用性仍需进一步研究,并且需要进行系统实验验证。
致谢:感谢中国地质调查局昆明自然资源综合调查中心分析测试实验室协助完成本项研究测试分析工作,使项目组能够顺利开展不同实验条件下氢氧化物系离子液体浸提剂对测定碱性土壤中有效磷含量的影响。
-
![]()
图 1 宋代茶叶末釉残片
(a)残片外侧;(b)残片内侧;(c)残片胎;(d)样本A;(e)样本B;(f)样本薄片。
Figure 1. Tea-dust glaze fragments made in Song Dynasty
![]()
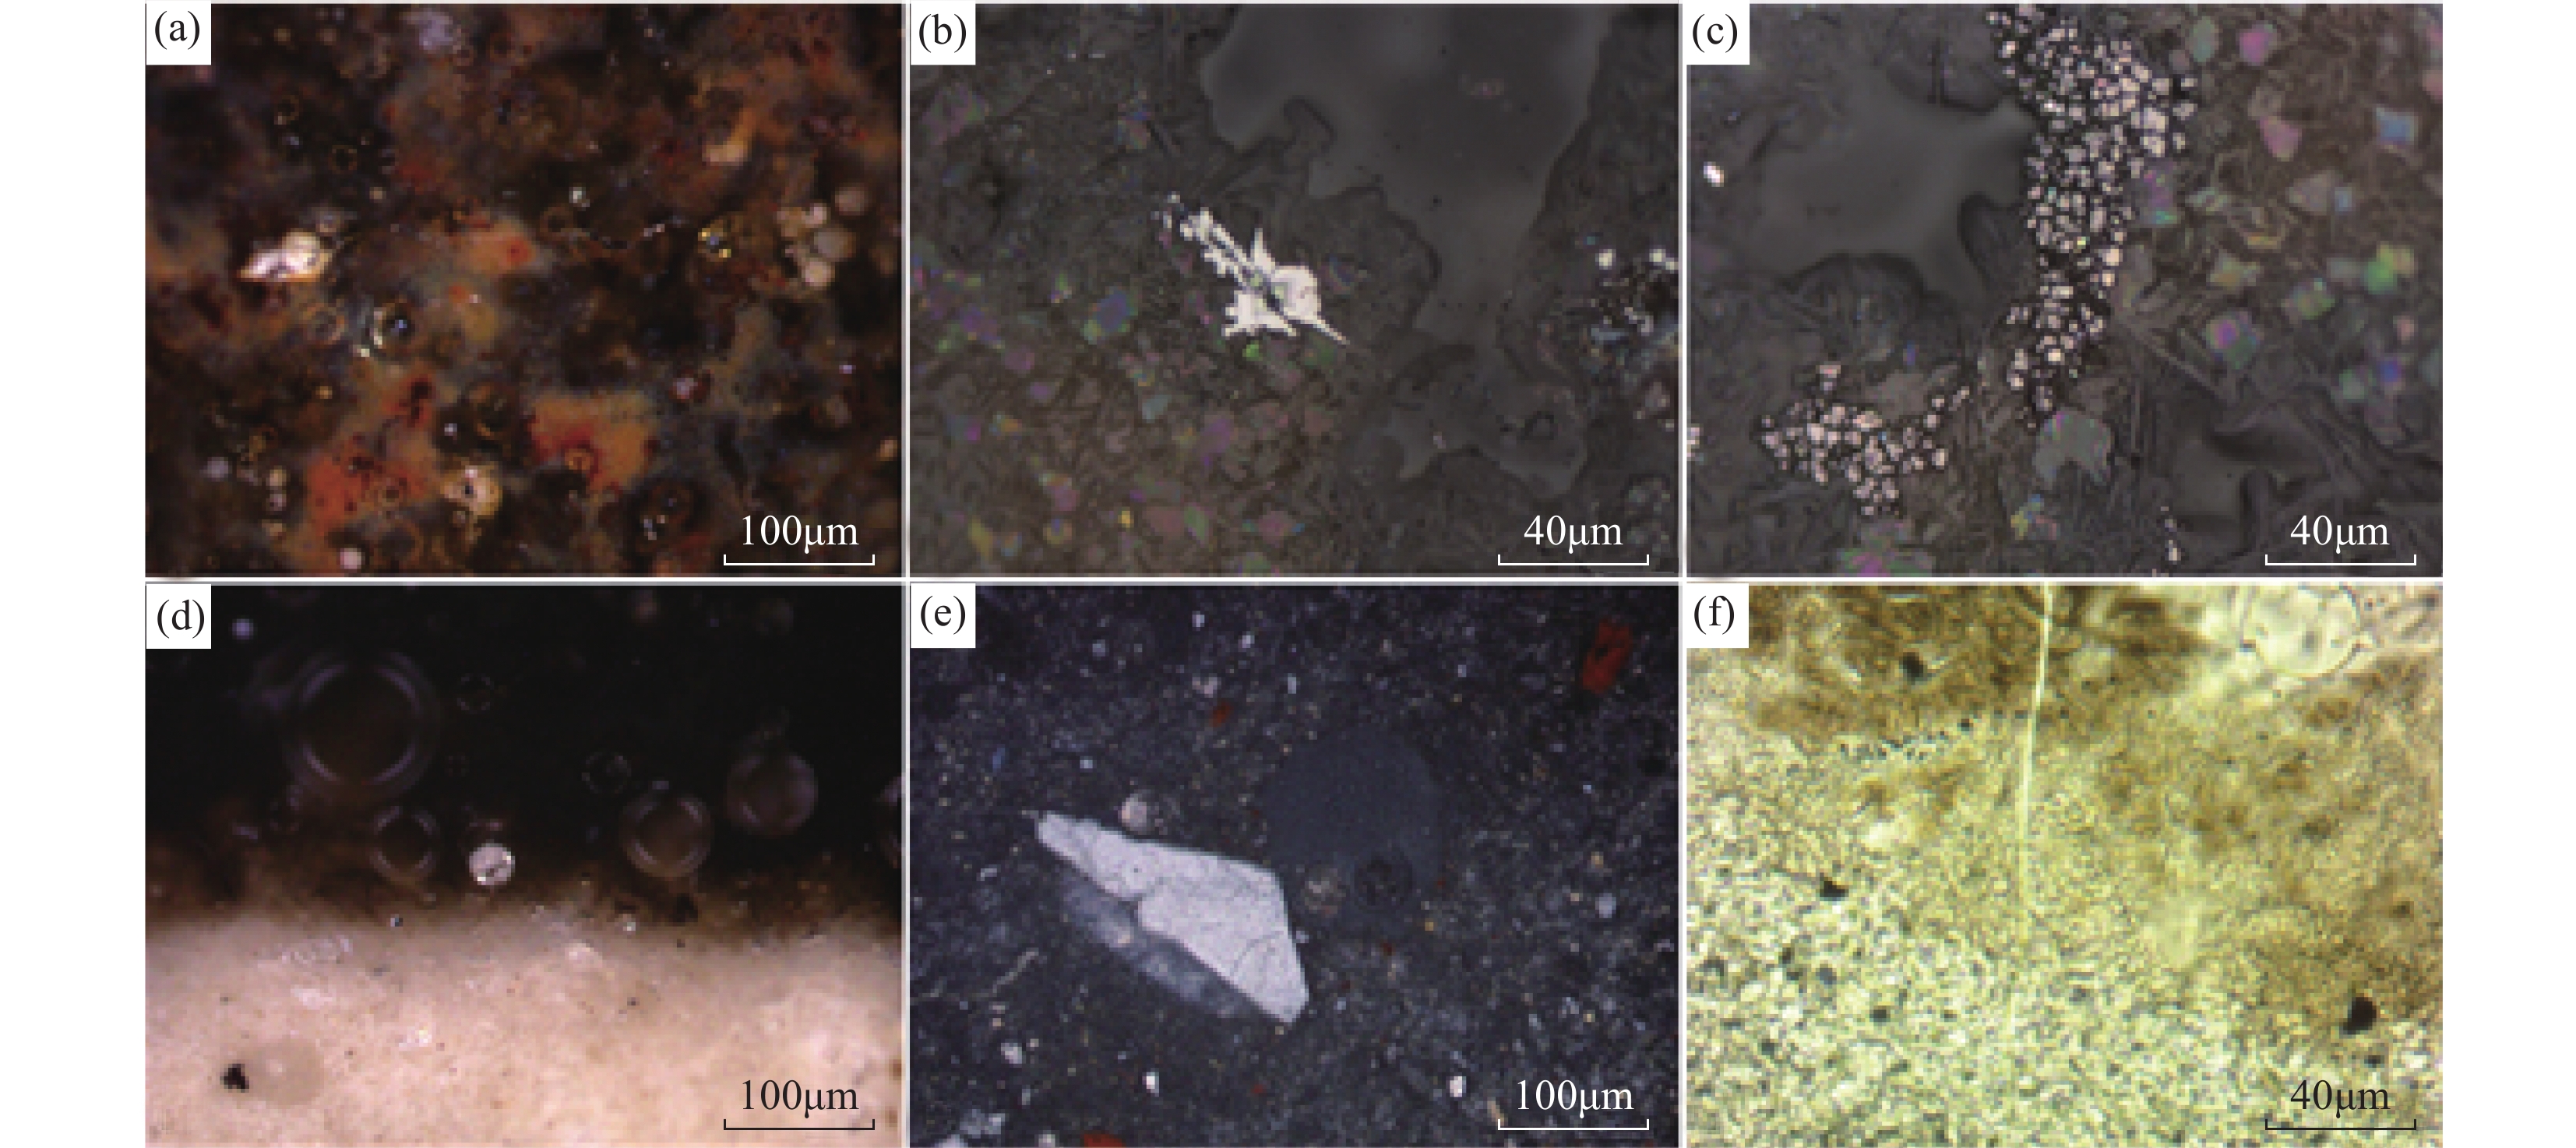
图 2 光学镜下茶叶末瓷中矿物图像
(a)釉面分布特征;(b)赤铁矿;(c)镁铁矿;(d)胎釉反应层;(e)胎(正交偏光);(f)反应层(单偏光)。
Figure 2. Optical images of minerals in tea-dust porcelain
![]()
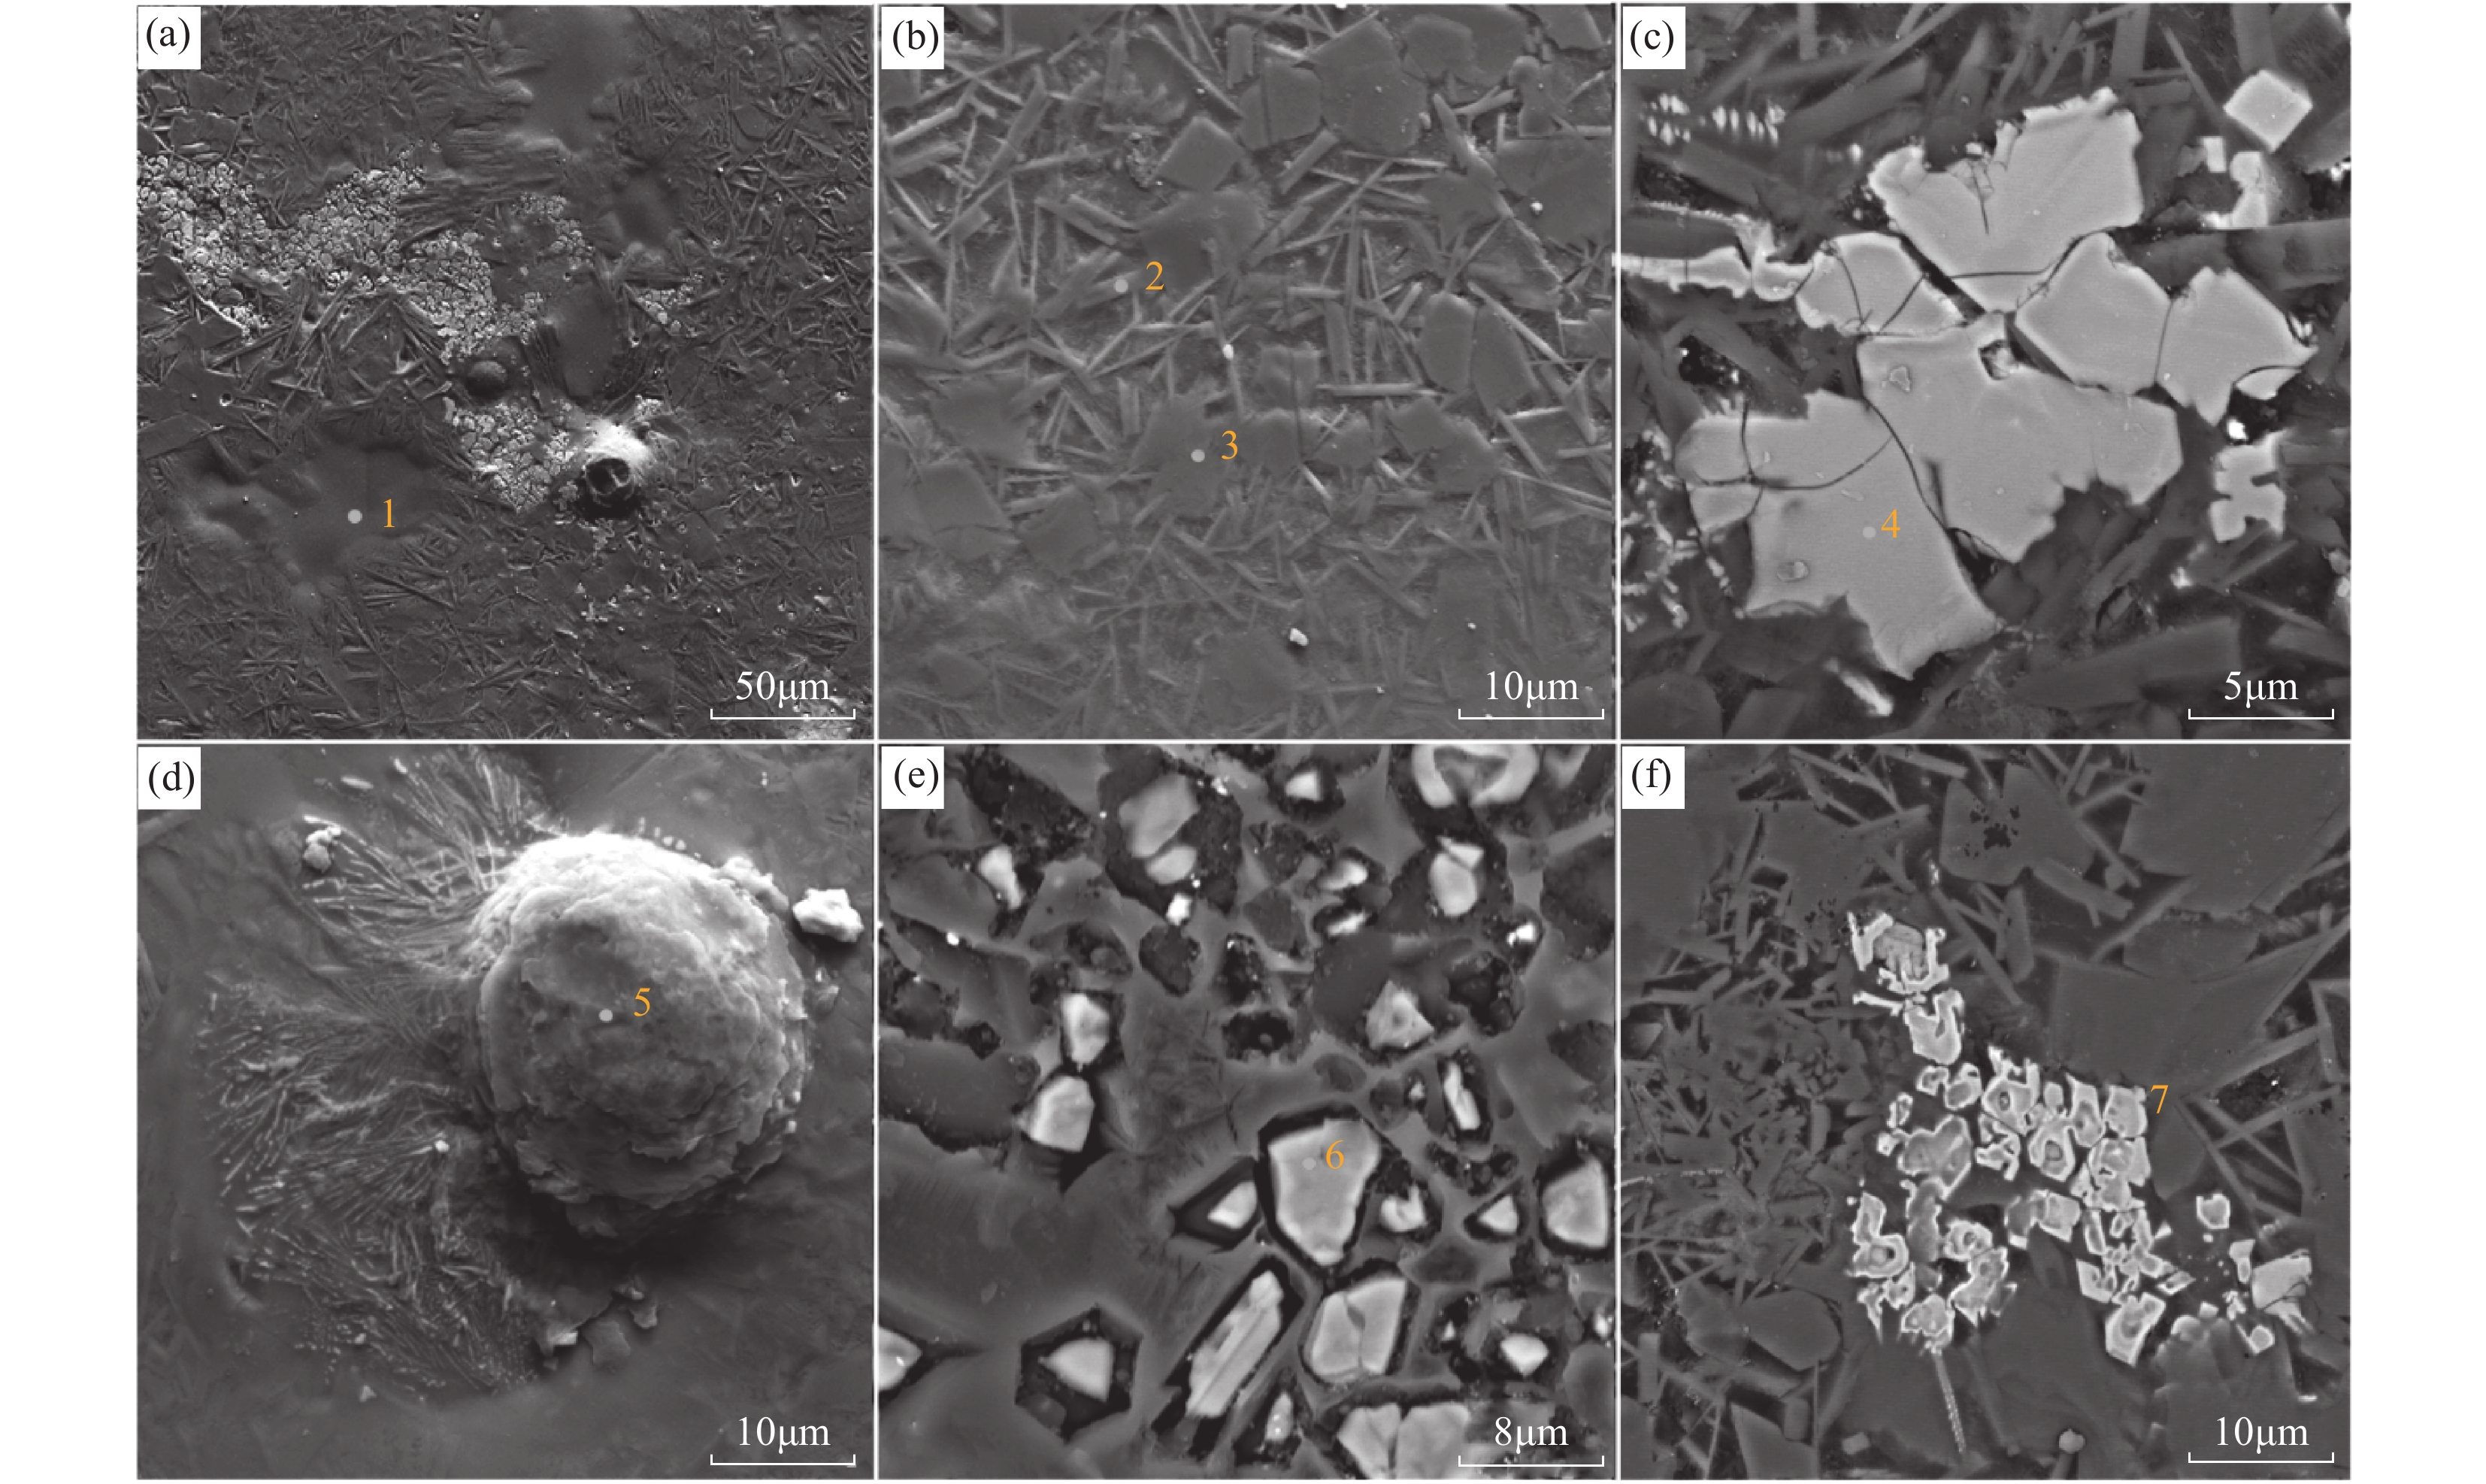
图 3 扫描电镜下茶叶末瓷中矿物图像
(a)釉面分布特征;(b)主晶相;(c)赤铁矿;(d)高岭石;(e)镁铁矿;(f)含钛磁铁矿。
Figure 3. Images of minerals in tea-dust porcelain by SEM
![]()
图 5 胎釉截面500μm×500μm二次离子图像
MC为单个像素点最大计数;TC为总计数。
Figure 5. Secondary ion images of the section of the body and glaze
表 1 茶叶末釉表面不同颜色斑点元素分析结果
Table 1 Analytical results of elements in different color spots of the tea-dust glaze
不同颜色斑点 元素含量(%) Na2O MgO Al2O3 SiO2 K2O CaO TiO2 Fe2O3 P2O5 MnO 黄褐色斑点 0.93 1.74 13.99 53.94 3.25 12.09 1.65 11.33 0.88 0.20 酱-黑色基质 0.96 1.58 12.44 58.96 4.03 10.32 1.28 9.73 0.53 0.17 整体 0.94 1.66 13.22 56.43 3.64 11.21 1.47 10.54 0.71 0.18  下载: 导出CSV
表 2 茶叶末瓷釉层中元素分析结果
Table 2 Analytical results of elements in glaze layer of tea-dust porcelain
釉面至釉底
行号元素含量(%) Na2O MgO Al2O3 SiO2 K2O CaO TiO2 Fe2O3 P2O5 MnO 第1行 0.87 1.28 18.36 57.44 3.62 10.29 0.94 6.92 0.16 0.11 第2行 0.84 1.68 13.36 59.79 3.84 9.94 1.16 9.05 0.19 0.16 第3行 0.87 1.55 13.13 61.50 4.37 9.34 0.92 8.03 0.12 0.15 第4行 0.84 1.65 12.59 61.53 4.42 9.18 0.88 8.60 0.14 0.16 第5行 0.86 1.65 13.51 60.63 3.88 9.66 0.93 8.60 0.12 0.16
下载: 导出CSV
表 3 EDS下矿物晶体元素组成
Table 3 Elemental composition of mineral crystals under EDS
EDS所取点位 元素原子占比(at%) Si Al Ca Fe Mg K Na Cr Ti Mn 1 63.67 13.8 8.14 3.97 3.61 4.85 1.96 / / / 2 60.59 21.39 7.99 2.08 2.48 1.07 4.22 / / 0.18 3 51.53 25.74 13.82 3.83 1.6 1.13 2.35 / / / 4 5.61 2.18 1.26 89.71 / 0.98 / / / / 5 41.2 34.14 3.26 4.79 4.37 2.78 3.03 / 5.87 / 6 1.85 / 0.43 65.59 29.93 0.23 / 1.96 / / 7 11.78 6.5 / 77.79 / / / / 3.92 / 注:元素原子占比低于0.10at%以“/”表示。
下载: 导出CSV
-
[1] 陈代璋, 袁家铮, 刘光辉. 结晶釉的绿辉石研究[J]. 地质论评, 1996, 42(2): 129−135. doi: 10.3321/j.issn:0371-5736.1996.02.005 Chen D Z, Yuan J Z, Liu G H. Green pyroxene studies of crystalline glazes[J]. Geological Review, 1996, 42(2): 129−135. doi: 10.3321/j.issn:0371-5736.1996.02.005
[2] Tao S, Liu S, Yuan Y, et al. Micro-structural and compositional study: ε-Fe2O3 crystals in the Hare’s Fur Jian Ware[J]. Crystals, 2022, 12(3): 367−371. doi: 10.21203/rs.3.rs-1130777/v1
[3] Wen R, Wang D, Wang L H, et al. The colouring mechanism of the Brown glaze porcelain of the Yaozhou Kiln in the Northern Song Dynasty[J]. Ceramics International, 2019, 45(8): 10589−10595. doi: 10.1016/j.ceramint.2019.02.125
[4] Chen X Y, Li W D, Xu C S, et al. Angle dependence of Jian bowl color and its coloring mechanism[J]. Journal of the European Ceramic Society, 2022, 42(2): 693−706. doi: 10.1016/j.jeurceramsoc.2021.10.057
[5] Wu B, Zhao W, Ren X, et al. Firing process and colouring mechanism of black glaze and brown glaze porcelains from the Yuan and Ming dynasties from the Qingliang Temple kiln in Baofeng, Henan, China[J]. Ceramics International, 2021, 47(23): 32817−32827. doi: 10.1016/j.ceramint.2021.08.178
[6] Li X Y, Lu J H, Yu X L, et al. Imitation of ancient black-glazed Jian bowls (Yohen Tenmoku): Fabrication and characterization[J]. Ceramics International, 2016, 42(14): 15269−15273. doi: 10.1016/j.ceramint.2016.06.027
[7] 黄瑞福, 陈显求, 陈士萍, 等. 唐代茶叶末瓷的物理化学基础研究[J]. 陶瓷学报, 1993, 14(2): 11−20. Huang R F, Chen X Q, Chen S P, et al. The physico-chemistry investigation on Tang Dynasty tea dust porcelain[J]. Journal of Ceramics, 1993, 14(2): 11−20.
[8] 张福康. 中国古陶瓷的科学[M]. 上海: 上海人民美术出版社, 2000: 82−91. [9] 陈尧成, 张筱薇, 黄秀纯, 等. 北京龙泉务窑辽金代黑瓷的制作工艺和显微结构研究[J]. 中国陶瓷, 1999, 35(6): 38−42. Chen Y C, Zhang X W, Huang X C, et al. Study on microstructure and technology of black porcelain of Beijing Longouanwu Kiln in Liao and Jin Dynasties[J]. China Ceramics, 1999, 35(6): 38−42.
[10] Bao Z A, Yuan H L, Wen R, et al. The fast and direct characterization of blue-and-white porcelain glaze from Jingdezhen by laser ablation-inductively coupled plasma mass spectrometry[J]. Analytical Methods, 2015, 7(12): 5034−5040. doi: 10.1039/C5AY00875A
[11] 何旭科, 栾燕, 孙晓辉, 等. 辽宁弓长岭铁矿床蚀变围岩中石榴石LA-ICP-MS面扫描分析及元素分布特征[J]. 岩矿测试, 2023, 42(4): 707−720. doi: 10.15898/j.ykcs.202211070212 He X K, Luan Y, Sun X H, et al. LA-ICP-MS Mapping and element distribution characteristics of garnet from the altered wall-rock of the Gongchangling iron deposit in Liaoning Province[J]. Rock and Mineral Analysis, 2023, 42(4): 707−720. doi: 10.15898/j.ykcs.202211070212
[12] 何焘, 张晨西, 张文, 等. 高空间分辨率LA-ICP-MS测定硅酸盐玻璃标准物质中42种微量元素[J]. 岩矿测试, 2023, 42(5): 983−995. doi: 10.15898/j.ykcs.202308090134 He T, Zhang C X, Zhang W, et al. Determination of 42 trace elements in silicate glass reference materials by high spatial resolution LA-ICP-MS[J]. Rock and Mineral Analysis, 2023, 42(5): 983−995. doi: 10.15898/j.ykcs.202308090134
[13] 陈晓峰, 胡芳菲, 张煦, 等. 激光剥蚀-电感耦合等离子体质谱法测定纯铜中铁锌砷锡锑铅铋[J]. 冶金分析, 2018, 38(12): 1−6. doi: 10.13228/j.boyuan.issn1000-7571.010363 Chen X F, Hu F F, Zhang X, et al. Determination of iron, zinc, arsenic, tin, antimony, lead and bismuth in pure copper by laser ablation inductively coupled plasma mass spectrometry[J]. Metallurgical Analysis, 2018, 38(12): 1−6. doi: 10.13228/j.boyuan.issn1000-7571.010363
[14] 付东旭, 郑令娜, 刘金辉, 等. 激光剥蚀-电感耦合等离子体质谱定量分析单细胞中的银纳米颗粒[J]. 分析化学, 2019, 47(9): 1390−1394. doi: 10.19756/j.issn.0253-3820.191283 Fu D X, Zheng L N, Liu J H, et al. Quantitative analysis of silver nanoparticles in single cell by laser ablation inductively coupled plasma-mass spectrometry[J]. Chinese Journal of Analytical Chemistry, 2019, 47(9): 1390−1394. doi: 10.19756/j.issn.0253-3820.191283
[15] 赵峰, 王占明, 王挺, 等. 激光剥蚀电感耦合等离子体质谱(LA-ICP-MS)法测定涂层氧化锆颗粒铌层中24种微量杂质元素[J]. 中国无机分析化学, 2023, 13(4): 374−381. doi: 10.3969/j.issn.2095-1035.2023.04.012 Zhao F, Wang Z M, Wang T, et al. Determination of 24 trace impurities in niobium coating of zirconia particles by laser ablation inductively coupled plasma mass spectrometry (LA-ICP-MS)[J]. Chinese Journal of Inorganic Analytical Chemistry, 2023, 13(4): 374−381. doi: 10.3969/j.issn.2095-1035.2023.04.012
[16] 周帆, 李明, 柴辛娜, 等. 非破坏性开放式激光剥蚀电感耦合等离子体质谱法原位测定大尺寸陶瓷样品主微量元素组成[J]. 岩矿测试, 2021, 40(1): 33−41. doi: 10.15898/j.cnki.11-2131/td.202005240075 Zhou F, Li M, Chai X N, et al. In-situ non-destructive determination of major and trace elements in large size ceramic samples by open laser ablation inductively coupled plasma-mass spectrometry[J]. Rock and Mineral Analysis, 2021, 40(1): 33−41. doi: 10.15898/j.cnki.11-2131/td.202005240075
[17] 李展平. 飞行时间二次离子质谱(TOF-SIMS)分析技术[J]. 矿物岩石地球化学通报, 2020, 39(6): 1173−1190. doi: 10.19658/j.issn.1007-2802.2020.39.104 Li Z P. Time-of-flight secondary ion mass spectro-metry[J]. Bulletin of Mineralogy, Petrology and Geochemistry, 2020, 39(6): 1173−1190. doi: 10.19658/j.issn.1007-2802.2020.39.104
[18] 阿尔弗来德·贝宁豪文, 查良镇. 飞行时间二次离子质谱—强有力的表面、界面和薄膜分析手段[J]. 真空, 2002(5): 10−14. doi: 10.3969/j.issn.1002-0322.2002.05.001 Benninghoven A, Zha L Z. TOF-SIMS—A powerful tool for practical surface, interface and thin film analysis[J]. Vacuum, 2002(5): 10−14. doi: 10.3969/j.issn.1002-0322.2002.05.001
[19] Timms N E, Kirkland C L, Cavosie A J, et al. Shocked titanite records Chicxulub hydrothermal alteration and impact age[J]. Geochimica et Cosmochimica Acta, 2020, 281: 12−30. doi: 10.1016/j.gca.2020.04.031
[20] 梁汉东. 金/硫团簇非共价键相互作用的研究与意义[J]. 中国矿业大学学报, 2001, 30(6): 593−599. doi: 10.3321/j.issn:1000-1964.2001.06.016 Liang H D. Investigation into non-covalent interaction between gold and sulfur clusters by TOF-SIMS[J]. Journal of China University of Mining & Technology, 2001, 30(6): 593−599. doi: 10.3321/j.issn:1000-1964.2001.06.016
[21] 梁汉东, 刘敦一. 金硫团簇负离子组成特征的探讨[J]. 物理化学学报, 2001, 17(9): 859−864. doi: 10.3866/PKU.WHXB20010921 Liang H D, Liu D Y. Compositional and constitutional characterization of Au-S cluster ions[J]. Acta Physico-Chimica Sinica, 2001, 17(9): 859−864. doi: 10.3866/PKU.WHXB20010921
[22] Liang H D. Secondary ion mass spectrometry of high-sulfur coal: Observation and interpretation of polysulfur ions[J]. Chinese Science Bulletin, 1999, 44(13): 1242−1245. doi: 10.1007/BF02885975
[23] Liang H D, Liang Y C, Gardella J A, et al. Potential release of hydrogen fluoride from domestic coal in endemic fluorosis area in Guizhou, China[J]. Chinese Science Bulletin, 2011, 56(22): 2301−2303. doi: 10.1007/s11434-011-4560-6
[24] Zhang T, Meng X, Bai Y, et al. Profiling the organic cation-dependent degradation of organolead halide pero-vskite Solar cells[J]. Journal of Materials Chemistry A, 2017, 5(3): 1103−1111. doi: 10.1039/C6TA09687E
[25] White L J, Taylor A J, Faulk D M, et al. The impact of detergents on the tissue decellularization process: A ToF-SIMS study[J]. Acta Biomaterialia, 2017, 50: 207−219. doi: 10.1016/j.actbio.2016.12.033
[26] 刘婕, 陈相龙, 梁汉东, 等. 新疆汉代羊毛织物染料的飞行时间二次离子质谱表征[J]. 质谱学报, 2024, 45(3): 386−395. doi: 10.7538/zpxb.2024.1009 Liu J, Chen X L, Liang H D, et al. Characterization of dyes for Han Dynasty wool fabrics in Xinjiang by time-of-flight secondary ion mass spectrometry[J]. Journal of Chinese Mass Spectrometry Society, 2024, 45(3): 386−395. doi: 10.7538/zpxb.2024.1009
[27] Ingo G M, Riccucci C, Pascucci M, et al. Combined use of FE-SEM plus EDS, ToF-SIMS, XPS, XRD and OM for the study of ancient gilded artefacts[J]. Applied Surface Science, 2018, 446: 168−176. doi: 10.1016/j.apsusc.2018.01.278
[28] Kaluzna-czaplinska J, Rosiak A, Grams J, et al. The studies of archaeological pottery with the use of selected analytical techniques[J]. Critical Reviews in Analytical Chemistry, 2017, 47(6): 490−498. doi: 10.1080/10408347.2017.1334534
[29] Felicissimo M P, Peixoto J L, Bittencourt C, et al. SEM, EPR and ToF-SIMS analyses applied to unravel the technology employed for pottery-making by pre-colonial Indian tribes from Pantanal, Brazil[J]. Journal of Archaeological Science, 2010, 37(9): 2179−2187. doi: 10.1016/j.jas.2010.03.015
[30] 徐子琪, 赵煊赫, 梁汉东, 等. 宋代黑釉茶盏油滴的飞行时间二次离子质谱表征[J]. 质谱学报, 2023, 44(1): 25−33. doi: 10.7538/zpxb.2022.0113 Xu Z Q, Zhao X H, Liang H D, et al. Characterization of oil spots on black-glazed teabowl made in Song Dynasty by time-of-flight secondary ion mass spectrometry[J]. Journal of Chinese Mass Spectrometry Society, 2023, 44(1): 25−33. doi: 10.7538/zpxb.2022.0113
[31] 刘婕, 梁汉东. 华北唐宋古瓷窑兴起的自然条件: 煤系地层出露[J]. 中国煤炭地质, 2024, 36(1): 12−17. doi: 10.3969/j.issn.1674-1803.2024.01.02 Liu J, Liang H D. Natural condition for the rise of ancient porcelain kilns of the Tang and Song Dynasties in North China: Outcrops of coal strata[J]. Coal Geology of China, 2024, 36(1): 12−17. doi: 10.3969/j.issn.1674-1803.2024.01.02
[32] Thompson J M, Meffre S, Danyushevsky L. Impact of air, laser pulse width and influence on U-Pb dating of zircons by LA-ICPMS[J]. Journal of Analytical Atomic Spectrometry, 2018, 33: 221−230. doi: 10.1039/C7JA00357A
[33] 顾幸勇, 方豪, 宋仪杰. 茶叶末结晶釉主晶相的研究[J]. 中国陶瓷, 1989, 25(2): 6−9. Gu X Y, Fang H, Song Y J. A study on principal crystalline phase of tea-dust crystalline glaze[J]. China Ceramics, 1989, 25(2): 6−9.
[34] Li W, Luo H, Li J, et al. Studies on the microstructure of the black-glazed bowl sherds excavated from the Jian Kiln site of ancient China[J]. Ceramics International, 2008, 34(34): 1473−1480. doi: 10.1016/j.ceramint.2007.04.004
[35] Ma Q L, Xu S Q, Wang J L, et al. Integrated analysis of a black-glazed porcelain bowl in Tushan Kiln dated back to Song Dynasty, China[J]. Materials Chemistry and Physics, 2020, 242: 122213. doi: 10.1016/j.matchemphys.2019.122213
[36] 陈显求, 陈士萍, 周学林, 等. 金、元时期旬邑窑茶叶末瓷的研究[J]. 陶瓷学报, 1996, 17(3): 15−24. Chen X Q, Chen S P, Zhou X L, et al. The study on Jin and Yuan Dynasties tea dust wares from Xunyi Kiln Site[J]. Journal of Ceramics, 1996, 17(3): 15−24.
[37] Wang M, Wang T, Wang F, et al. Raman study of rusty oil spotted glaze produced in Linfen Kilns (Shanxi Province, AD1115–1368)[J]. Journal of Raman Spectroscopy, 2020, 53(3): 582−592. doi: 10.1002/jrs.6229
[38] Wang T, Hole C, Ren Z, et al. Morphological and structural study of crystals in black-to-brown glazes of Yaozhou ware (Song Dynasty) using imaging and spectroscopic techniques[J]. Journal of the European Ceramic Society, 2021, 41(12): 6049−6058. doi: 10.1016/j.jeurceramsoc.2021.05.025
[39] 王秀玲, 侯亮亮, 王敏力, 等. 山西大同浑源窑出土黑釉剔花瓷片的科技分析[J]. 中国陶瓷, 2022, 58(8): 53−58. doi: 10.16521/j.cnki.issn.1001-9642.2022.08.009 Wang X L, Hou L L, Wang M L, et al. Scientific and technological analysis of black-glazed carving ware of Hunyuan Kilns in Datong, Shanxi Province[J]. China Ceramics, 2022, 58(8): 53−58. doi: 10.16521/j.cnki.issn.1001-9642.2022.08.009
[40] 付玲芝. 辽宁省弓长岭铁矿磁铁矿-赤铁矿转变机制研究[D]. 长春: 吉林大学, 2016: 58−62. Fu L Z. Study on mechanism of transforming between magnetite and hematite of Gongchangling iron deposit in Liaoning Province[D]. Changchun: Jilin University, 2016: 58-62.
[41] 程桂亮, 姚奉洪, 杨开玉, 等. 耐热陶瓷的研究[J]. 中国陶瓷, 1988(1): 22−28. doi: 10.16521/j.cnki.issn.1001-9642.1988.01.003 Cheng G L, Yao F H, Yang K Y, et al. A study on temper-ware[J]. China Ceramics, 1988(1): 22−28. doi: 10.16521/j.cnki.issn.1001-9642.1988.01.003
[42] Wang M, Zhu T Q, Ding X, et al. Composition comparison of Zhejiang Longquan celadon and its imitation in Dapu Kiln of Guangdong in the Ming Dynasty of China (1368—1644 CE) by LA-ICP-MS[J]. Ceramic International, 2018, 44(2): 1785−1796. doi: 10.1016/j.ceramint.2017.10.112


计量
- 文章访问数: 136
- HTML全文浏览量: 19
- PDF下载量: 41
 京公网安备 11010202008159号