
Rare Earth Element Contents and Occurrence Forms in Weathering Crust Ion Adsorption Rare Earth Ore
-
摘要:
风化壳离子吸附型稀土矿床具有稀土元素(REEs)种类齐全、放射性活性低、重稀土含量高,且易开采等特点,是一种极为重要的稀土矿床类型。当前,有关该矿床中稀土元素的测定研究大都只测定了稀土元素全量及离子相分量,且有些方法操作流程较繁琐,对于稀土元素的各种赋存形态分析研究较少。但在研究风化壳离子吸附型稀土矿床的成矿规律时,不仅要分析其稀土元素全量,还需要分析影响该矿床中稀土元素的成矿背景、迁移、富集过程中移动差异性、长期性和可利用性的化学形态,因此,准确测定风化壳离子吸附型稀土矿床中稀土元素全量及各赋存形态含量非常必要。本文以五酸混合消解作为测定风化壳离子吸附型稀土矿样品中稀土元素全量的前处理方法,并将BCR法和Tessier法提取的稀土元素形态结果进行对比,以ICP-MS为检测手段,探讨了样品中稀土元素全量及各赋存形态含量分布情况。结果表明,五酸混合消解能将稀土矿样品中所有稀土元素完全溶出,且操作简便,方法精密度(RSD)为0.82%~5.19%,检出限为0.002~0.027μg/g,各元素测定值与认定值的相对误差为−4.70%~6.65%,∑LREEs/∑HREEs为1.25~16.50,涵盖轻稀土和重稀土富集。BCR法和Tessier法提取的稀土元素各形态结果的相对偏差(RD)为0.79%~8.07%,提取结果基本能相互对应吻合,∑REEs回收率为84.75%~107.13%,∑REEs测定值的相对偏差(RD)为0.62%~21.00%,相对误差(RE)小于40%。相较之下,BCR法前处理流程简单,但是划分的形态没有Tessier法直观、具体,无法获取更详细的各形态数据,在本文实验条件下,Tessier法对于稀土元素形态分析可能具有较好的适应性。风化壳全风化层样品中稀土元素主要以离子吸附态赋存在黏土类矿物表面,因而离子交换态含量最高,随着风化壳剖面深度增加,pH升高,稀土元素更容易与碳酸根或碳酸氢根结合,导致碳酸盐结合态中稀土元素含量增大,Ce元素在该层中极易从Ce3+氧化成Ce4+,以沉淀形式滞留于原地,不同于其他稀土元素分异-富集特征,形成Ce异常;而母岩中的稀土元素主要富集在独立矿物晶格中,残渣态含量最高,各赋存形态下所有稀土元素变化规律基本一致。
要点(1)在经典四酸基础上加入少量硫酸,有利于难溶稀土氟化物的分解,可以实现稀土元素完全溶出。
(2) BCR法和Tessier法提取的稀土元素形态结果基本能相互对应吻合。
(3)风化壳中稀土元素全量及各赋存形态的含量差异与风化程度、矿物组成等因素密切相关。
(4) Ce在风化壳全风化层中极易从Ce3+氧化成Ce4+,以胶态相或矿物相沉淀滞留于原地,形成Ce异常。
HIGHLIGHTS(1) Adding a small amount of sulfuric acid to the classic four-type acid system is beneficial for the decomposition of insoluble rare earth fluorides, which can obtain complete dissolution of REEs.
(2) REE forms extracted by the BCR method and Tessier method correspond and match each other.
(3) The differences in the total amount and various REE forms in weathered crust are closely related to factors such as weathering degree and mineral composition.
(4) Ce element is easily oxidized from Ce3+ to Ce4+ in the fully weathered layer of the weathering crust, and stays in situ in the form of colloidal or mineral phase precipitation, resulting in Ce anomaly.
Abstract:The weathering crust ion adsorption type rare earth deposit has the characteristics of complete REE types, low radioactivity, high heavy rare earth contents, and easy mining, making it an extremely important type of rare earth deposit. At present, most of the research on the determination of REEs in this deposit only measures the total amount and ionic phase components of REEs, and some methods have complicated operating procedures, while there is relatively little research on the analysis of various REE forms. However, when studying the mineralization laws of weathering crust ion adsorption type rare earth deposits, it is not only necessary to analyze the total amount of REEs, but also to analyze the chemical forms that affect the mineralization background, migration, enrichment process, long-term differences, and availability of REEs in the deposit. Therefore, it is necessary to accurately determine the total amount and contents of various occurrence REE forms in weathering crust ion adsorption type rare earth deposits. In this article, a five acid mixed digestion was used as a pretreatment method for determining the total amount of REEs, and the results of rare earth elements speciation analysis determined by BCR method and Tessier method were compared. ICP-MS was used as the detection method to explore the distribution of the total amount and various REE forms in the samples. The results show that the five-acid mixed digestion can completely dissolve all REEs in the rare earth ore sample, and the operation is simple. The precision (RSD) of this method was between 0.82% to 5.19%, the detection limit was between 0.002g/g to 0.027g/g, and the relative error between the measured value and the recognized value of each element was between −4.70% to 6.65%. The ∑LREEs/∑HREEs was between 1.25 to 16.50, covering the enrichment of light rare earths and heavy rare earths. The relative deviation (RD) of rare earth forms extracted by the two methods of BCR and Tessier was 0.79% to 8.07%, and the extraction results correspond and match each other. The rate of recovery was between 84.75% to 107.13%. The RD of ∑REEs determination values was between 0.62% to 21.00%, and the relative error (RE) was less than 40%. In contrast, the BCR method has a simpler pre-processing flow, but the partitioned forms are not as intuitive and specific as the Tessier method, which cannot be used to obtain more detailed data on each form. Thus, under the conditions of this experiment, the Tessier method may have good adaptability for rare earth form analysis. REEs in the fully weathered layer samples of the weathering crust mainly exist on the surface of clay minerals in the form of ion adsorption, resulting in the highest content of ion exchange state. As the depth of the weathering crust profile increases and the pH rises, REEs are more likely to bind with carbonate or bicarbonate ions, leading to an increase in the rare earth contents in the carbonate bound state. Elemental Ce is easily oxidized from Ce3+to Ce4+ in this layer, and stays in situ in the form of precipitation, resulting in Ce anomaly; REEs in the parent rock are mainly enriched in the independent mineral lattice, with the highest residual content. The variation patterns of all REEs under different occurrence forms are basically consistent.
-
硅元素被国际土壤界认为继氮、磷、钾之后的第四种植物营养元素[1]。硅对植物的形态特征、生理特征和植物体内其他营养元素的分布有一定影响。硅可以促进植物生长,提高光合作用,提高根系活力,增强抗病能力,提高植物产量等[2]。土壤中硅的含量差异较大,形态也多种多样,主要有石英、二氧化硅以及硅酸盐或铝硅酸盐,其含量测定尤为重要[3-4]。
土壤和沉积物中硅含量测定的报道诸多,主要有分光光度法、X射线荧光光谱法(XRF)、激光诱导击穿光谱技术和电感耦合等离子体发射光谱法(ICP-OES)[5-10]。分光光度法操作繁琐、要求高,不适合批量样品测试[11]。行业标准《土壤和沉积物 无机元素的测定 波长色散X射线荧光光谱法》(HJ 780—2015)中采用XRF法需要高温熔融制样[12],并且建立校准曲线比较繁琐。激光诱导击穿光谱技术的测试结果与标准值基本吻合[13],准确度有待提高。ICP-OES法具有分析速度快、线性范围宽、检出限低、准确度高,并且能同时分析多种元素的优点,得到了广泛应用。ICP-OES法测定硅含量的前处理方法主要有碱性熔剂熔融制样或多种混合酸消解样品。行业标准《土壤和沉积物 11种元素的测定 碱熔-电感耦合等离子体发射光谱法》(HJ 974—2018)采用碱性熔剂高温熔融,酸解后利用ICP-OES法测定土壤和沉积物中硅含量。王龙山等[14]报道了一种采用高温熔融,超声提取ICP-OES测定岩石、水系沉积物和土壤样品中硅含量的方法。余浪等[3]报道了一种采用盐酸-硝酸-氢氟酸混合酸,100~110℃微波消解样品,以铑为内标,基体匹配法测定硅含量的方法。杨娜等[15]采用微波消解,ICP-OES法测定硅含量。采用ICP-OES法测定硅含量时,碱熔法引入大量盐,测试时会有基体干扰;浸提法只能测定有效硅含量;微波消解设备相对昂贵;传统消解方法易造成硅挥发损失。因此,亟需开发一种前处理简单、效率高、准确度高、经济实惠的测定土壤中全硅含量的方法。
用超声作为样品前处理有诸多报道,包括超声消解电感耦合等离子体质谱法(ICP-MS)测定烟丝中钾钠钙镁元素含量[16]、超声辅助逆王水提取ICP-MS测定PM2.5颗粒物中24种金属元素含量[17],以及超声波水浴消解ICP-MS法测定土壤中Mn、Co、As、Ag、Cd、Sb和Bi元素含量[18]。在这些报道中,主要采用超声提取或超声辅助半消解测定样品中部分元素,这些元素稳定并且比较容易提取。本文在超声消解基础上,考虑混合酸消解时氢氟酸与硅反应生成的氟化硅易挥发损失、难以准确测定的特点,采用稀王水-氢氟酸-双氧水在密闭条件下超声消解样品,并对是否超声、是否密闭、超声条件及双氧水的加入量进行探讨,采用ICP-OES测定硅元素含量。将建立的方法测定国家标准物质GBW07401a(GSS-1a)、GBW07405a (GSS-5a)、GBW07377 (GSD-26)、GBW07379 (GSD-28)中硅含量,并与XRF结果进行对比,验证了方法的准确性和可靠性。
1. 实验部分
1.1 仪器与工作参数
Avio 500型电感耦合等离子体发射光谱仪(美国PerkinElmer公司);超纯水机(MILLI-Q ADVANTRGE A10);超声波清洗机(春霖公司)。
仪器谱线范围163~782nm;耐氢氟酸系统;功率1400W;进样量1.5mL/min;等离子气流速12L/min;辅助气流速0.5L/min;雾化气流速0.7L/min;径向观测方式。硅的分析谱线有251.611nm、212.412nm、288.158nm、252.851nm等,根据分析谱线的选取原则,分析应该选择灵敏度高、干扰少、线性范围宽的谱线,同时参照仪器推荐,最终选取元素的分析谱线为Si 251.611nm。
1.2 主要试剂
硝酸(CMOS纯,高纯半导体级);盐酸(CMOS纯,高纯半导体级);氢氟酸(CMOS纯,高纯半导体级);双氧水(优级纯);硅标准溶液(1000mg/L):购自国家有色金属及电子材料分析测试中心。
1.3 样品和标准物质
土壤实际样品:在云南松林内设置一块20m×20m样地。在样地内按照S形路线,选取9个点,采集0~10cm表层土壤样品混合成一份样品,每份样品进行编号。样品带回实验室进行风干,去除石块和根系,研磨,过100目筛,部分样品用于测试分析。编号分别为8、18、23、28、31作为实际样品测试。
标准物质GBW07401a (GSS-1a):暗棕壤,黑龙江西林铅锌矿区土壤,采用XRF法及重量法定值。GBW07405a (GSS-5a):黄红壤,江西七宝山多金属矿区土壤,采用XRF法及重量法定值。GBW07377 (GSD-26):水系沉积物成分标准物质,西藏纳木错沉积岩区,采用容量法定值。GBW07379 (GSD-28):水系沉积物成分标准物质,云南兰坪铅锌矿区,采用容量法定值。以上标准物质都是中国地质科学院地球物理地球化学勘查研究所研制。
1.4 样品溶液和标准溶液的制备
样品溶液:准确称取 0.05~0.10g样品置于 50mL离心管中,精确至0.0001g,加入20mL水润湿,加6mL王水、6mL氢氟酸、6mL双氧水,密封后于75℃超声1h,待溶液冷却至室温后转移至1000mL塑料容量瓶中,用超纯水定容后摇匀,待用。若浓度过高,用超纯水稀释后测定样品;若有不溶物,静置过夜后取上清液测定样品。
标准溶液:分别移取硅元素标准溶液(1000mg/L)0、0.5、1、1.5、2、3、5mL于6支100mL容量瓶中,分别加入2%硝酸定容,配制成浓度为0、5、10、15、20、30、50mg/L系列的标准溶液。
2. 结果与讨论
2.1 样品前处理对硅含量测试结果的影响
土壤和沉积物中硅含量测定方法是:样品先与碱性熔剂熔融,熔融物经酸溶解后用ICP-OES进行测定。样品前处理操作繁琐,且熔融过程引入了大量碱金属,测定时基体效应明显。本文采用超声密闭混合酸(稀王水-氢氟酸-双氧水)消解土壤和沉积物中的硅,测定时用耐氢氟酸系统,并且定容至1000mL减少基体效应。为确定密闭条件、超声条件及双氧水的加入量对样品前处理的影响,进行了不同消解条件下的对比实验。
2.1.1 不同消解条件对样品测试结果的影响
以GBW07401a (GSS-1a)为例,在相同的酸浓度、密封条件及反应时间(1h)内,对样品分别进行静置、75℃加热及75℃超声处理,测试结果列于表1,并计算测试结果的相对误差。样品溶液加酸后,静置条件下测试结果明显偏低;75℃加热时测试结果有所提高,但测试结果仍偏低;75℃超声处理样品时,测定值与理论值符合。超声的空化作用及非线性效应有利于样品溶液的分散及促进化学反应进行,加速样品消解。因此,消解土壤和沉积物样品中的硅时,需要在75℃下超声处理样品。
表 1 不同消解条件下样品测试结果的比较Table 1. Comparison of results with different digestion conditions序号 实验条件 SiO2含量测定值
(%)RSD
(%)以SiO2计平均值
(%)SiO2含量认定值及
不确定度(%)以SiO2计相对误差
(%)1 静置 39.86 39.90 40.26 0.6 40.01 56.60±0.46 −29.31 2 75℃加热 51.13 51.34 50.92 0.4 51.13 56.60±0.46 −9.67 3 75℃超声 57.29 56.41 55.71 1.4 56.47 56.60±0.46 −0.23 2.1.2 密闭效果对样品前处理的影响
为确定密闭效果对样品前处理的影响,以GBW07401a(GSS-1a)为例,在相同的酸浓度、超声温度及时间内(1h),进行了敞口、半封闭、密闭不同条件下处理样品,测试结果与理论值的相对误差越来越小(表2)。敞口或半封闭条件下消解样品,测试结果偏低;全封闭效果较好。可能是因为敞口或半封闭时,反应生成的四氟化硅易挥发损失,导致测试结果偏低,而密封条件下避免了硅的损失。超声消解样品,密闭条件下压力增加,与非密闭条件相比,相当于增加了温度和压力,样品在温度与压力的双重作用下消解速率加快,反应时间减少。因此,消解土壤和沉积物样品时需要采用密闭条件。
表 2 密闭条件对样品消解效果的影响Table 2. Influence of different sealing conditions on sample digestion序号 密闭方式 SiO2含量测定值
(%)RSD
(%)以SiO2计平均值
(%)SiO2含量认定值和
不确定度(%)以SiO2计相对误差
(%)1 敞口 49.14 49.14 48.84 0.3 49.04 56.60±0.46 −13.36 2 半密封 51.07 50.92 50.02 1.1 50.67 56.60±0.46 −10.48 3 密闭 57.29 56.41 55.71 1.4 56.47 56.60±0.46 −0.23 2.1.3 超声温度对样品前处理的影响
为确定超声温度对样品前处理的影响,以GBW07401a(GSS-1a)为例,在相同的酸浓度、密封条件及反应时间(1h)内,对样品分别进行不同温度下超声处理,测试结果列于表3,并计算测试结果的相对误差。室温(25℃)及45℃超声处理后,测试结果均偏低;75℃超声1h,测试结果与理论值相符;温度升高至85℃,测试结果与理论值基本相符。低温条件下超声对消解效果影响不明显,可能只是分散作用;随着超声温度升高,超声与加热的双重作用使消解速率逐渐加快。温度太低不利于消解反应的进行,需要很长时间才能消解完全;温度太高,可能会影响离心管密封效果,导致结果偏低。因此,消解土壤和沉积物样品中的硅时选择75℃。
表 3 超声温度对样品消解效果的比较Table 3. Comparison of results with different ultrasound temperature序号 超声温度
(℃)SiO2含量测定值
(%)RSD
(%)Si含量平均值
(%)以SiO2计平均值
(%)SiO2含量认定值和
不确定度(%)以SiO2计相对误差
(%)1 25 40.48 40.82 40.82 0.5 19.03 40.71 56.60±0.46 −28.07 2 45 45.59 45.46 44.88 0.8 21.18 45.31 56.60±0.46 −19.95 3 75 57.29 56.41 55.71 1.4 26.40 56.47 56.60±0.46 −0.23 4 85 55.45 56.71 56.18 1.1 26.23 56.11 56.60±0.46 −0.87 2.1.4 超声时间对样品前处理的影响
为确定超声时间对样品前处理的影响,以GBW07401a(GSS-1a)为例,在相同的酸浓度、密封条件及反应温度下,对样品分别进行不同超声时间处理,测试结果列于表4,并计算相对误差。75℃下超声0.5h,样品大部分已消解完全,超声1h样品已消解完全。随着超声时间延长,消解结果逐渐完全并保持稳定,测试结果与理论值越来越接近,相对误差也越来越小。为节省时间,选择样品溶液超声1h。
表 4 超声时间对样品前处理效果的比较Table 4. Comparison of results with different ultrasound time序号 超声时间
(h)SiO2含量测定值
(%)RSD
(%)Si含量平均值
(%)以SiO2计平均值
(%)SiO2含量认定值和
不确定度(%)以SiO2计相对误差
(%)1 0.5 50.34 49.68 50.38 0.8 23.43 50.13 56.60±0.46 −11.43 2 1 57.29 56.41 55.71 1.4 26.40 56.47 56.60±0.46 −0.23 3 2 57.08 57.10 56.22 0.9 26.55 56.80 56.60±0.46 0.35 4 3 56.26 56.50 56.29 0.2 26.34 56.35 56.60±0.46 −0.44 2.1.5 超声功率对样品前处理的影响
为确定超声功率对样品前处理的影响,以GBW07401a(GSS-1a)为例,在相同的酸浓度、密封条件、超声温度及超声时间内,对样品进行不同功率超声处理,测试结果列于表5,并计算测试结果的相对误差。随着超声功率增加,硅含量测试值逐渐增大,并与理论值越来越接近,测试值的相对误差也越来越小。当超声功率增大到一定值,测试结果与理论值相符。因此,消解样品时选择300W功率。
表 5 超声功率对样品前处理效果的测试结果比较Table 5. Comparison of results with different ultrasound powder序号 超声条件 Si含量测定值
(%)RSD
(%)Si含量测定平均值
(%)以SiO2计平均值
(%)SiO2含量认定值
及不确定度(%)以SiO2计相对误差
(%)1 75℃超声功率120W 56.44 55.64 55.39 1.0 26.09 55.82 56.60±0.46 −1.38 2 75℃超声功率240W 55.90 55.97 55.75 0.3 26.10 55.87 56.60±0.46 −1.29 3 75℃超声功率300W 57.29 56.41 55.71 1.4 26.40 56.47 56.60±0.46 −0.23 4 75℃超声功率360W 56.50 56.95 56.97 0.5 26.55 56.80 56.60±0.46 0.35 2.1.6 双氧水对样品前处理效果的影响
超声条件确定后,为确定双氧水对样品消解的影响,以GBW07401a(GSS-1a)为例,在其他条件相同的情况下,进行了不同添加量的双氧水对样品消解对比实验,测试结果见表6,并计算测试结果的相对误差。相同超声条件下,不加双氧水时,测试结果明显偏低;加入3mL双氧水后,测试结果有一定程度提高,但还是低于理论值;加入6mL双氧水和加入9mL双氧水后测试结果均与理论值相符,因此选择加入6mL双氧水。
表 6 不同添加量的双氧水对样品进行消解测试结果比较Table 6. Comparison of results with different amounts of hydrogen peroxide added序号 双氧水用量
(mL)Si含量测定值
(%)RSD
(%)Si含量测定平均值
(%)以SiO2计平均值
(%)SiO2含量认定值
及不确定度(%)以SiO2计相对误差
(%)1 0 42.89 42.25 42.44 0.8 19.88 42.53 56.60±0.46 −24.86 2 3 50.30 48.97 48.50 1.9 23.02 49.26 56.60±0.46 −12.97 3 6 57.29 56.41 55.71 1.4 26.40 56.47 56.60±0.46 −0.23 4 9 55.92 55.73 56.78 1.0 26.24 56.14 56.60±0.46 −0.81 采用稀王水-氢氟酸-双氧水消解试样,75℃密闭条件下超声,可发生的反应有:
HNO3+3HCl= 2H2O+Cl2+NOCl
H2O2+HNO3=HNO2+H2O+O2↑
2H2O2+2HCl=2HClO+2H2O=O2+2HCl+2H2O
Cl2+H2O2=2HCl+O2
3mL盐酸和1mL硝酸加热时,生成的氯化亚硝酰和新生的氯气具有较强的氧化性;双氧水与硝酸反应生成的亚硝酸,它的氧化能力在稀溶液时比NO3−离子还强;双氧水与盐酸反应生成的次氯酸具有很强的氧化性,可以把盐酸氧化成氯气;因此,反应生成的各种氧化性物质与酸的作用加速了样品溶解,并且土壤和沉积岩样品分解后的大多数矿物生成氯化物或氯配离子转入溶液,氯离子的配位作用进一步加速了样品溶解。稀酸处理样品,生成的氟化硅与水反应生成氟硅酸和硅酸。3SiF4+4H2O=2H2SiF6+H4SiO4,促进大量硅元素进入水溶液,减少了SiF4气体含量,抑制硅元素损失。采用稀王水-氢氟酸-双氧水消解试样,大大提高了反应效率,缩短反应时间,简化了前处理操作。表明土壤和沉积物中硅的测定可采用稀王水-氢氟酸-双氧水在全封闭条件下,75℃超声1h,测试结果准确。
2.2 校准曲线和方法检出限
将配制好的标准溶液在仪器工作条件下进行测定,分析线251.611nm,以Si元素浓度为横坐标、强度为纵坐标,采用线性计算截距的方式,绘制标准曲线。Si元素线性回归方程为:y=3573.41847x−430.08986,相关系数为0.999974,在5~50mg/L范围内线性良好。在最优工作条件下,按照实验方法,连续测定11次2%硝酸空白溶液,硅含量测试结果(mg/L)分别为:0.145、0.147、0.146、0.145、0.146、0.145、0.146、0.145、0.144、0.144、0.144。以测试结果的3倍标准偏差乘以稀释倍数(按称重0.1g,定容到1000mL),计算方法检出限为0.0395mg/g。
2.3 方法精密度和准确度验证
选取不同种类的国家标准物质GBW07401a、GBW07405a、GBW07377、GBW07379进行测试,每个标准物质平行分析 11 次。计算平均值与标准值之间的相对误差(%)来衡量方法准确度;计算 11 次平行测定的相对标准偏差(RSD)来衡量方法精密度。由表7可知,RSD在 0.26%~0.54%,说明方法精密度良好。ICP-OES测定值与标准值的相对误差在−0.28%~0.25%,说明方法准确度良好。
表 7 方法精密度和准确度实验Table 7. Precision and accuracy tests of the method标准物质编号 Si含量测定值
(%)RSD
(%)Si含量测定
平均值(%)以SiO2计
平均值(%)SiO2含量认定值
及不确定度(%)以SiO2计
相对误差(%)GBW07401a 56.91 56.80 56.84 0.40 26.52 56.74 56.60±0.46 0.25 56.22 56.93 56.65 56.99 56.71 56.91 56.69 56.50 GBW07405a 61.48 61.18 61.81 0.31 28.68 61.35 61.52±0.39 −0.28 61.16 61.33 61.25 61.21 61.21 61.44 61.36 61.38 GBW07377 63.50 63.17 63.75 0.26 29.65 63.43 63.48±0.43 −0.08 63.52 63.47 63.43 63.35 63.28 63.56 63.24 63.50 GBW07379 69.38 69.98 69.21 0.54 32.62 69.75 69.66±0.6 0.13 70.15 69.79 70.08 69.87 70.17 69.76 69.12 69.70 2.4 不同分析方法测试结果比对
为确定该方法的实用性,选取了不同硅含量的土壤实际样品,样品编号分别为8、18、23、28、31,每个样品称取5个平行样品,用本文的超声法快速消解样品并测试,同时用XRF法进行测定(三次测定,给出平均值)。由表8测试结果可知,实际样品两种方法比对发现,结果有部分偏差,两种方法的相对误差在−12.6%~27.1%,说明这两种方法测定结果偏差较大。而采用本文方法测定不同硅含量土壤样品的RSD为0.52%~0.77%,测试结果精密度良好,表明本文方法适用于实际样品测试。
表 8 实际样品测试结果比对Table 8. Comparison of analytical results of SiO2 content in actual samples实际样品编号 本文方法Si含量测定值
(%)RSD
(%)Si含量测定平均值
(%)XRF法Si含量测定值
(%)相对误差
(%)样品8 29.98 29.72 30.18 29.68 29.90 0.68 29.89 26.12 −12.60 样品18 12.13 12.03 12.22 12.04 12.06 0.66 12.10 15.38 27.10 样品23 14.91 15.11 14.95 14.93 15.17 0.77 15.01 17.07 13.70 样品28 29.93 29.75 29.80 29.86 30.15 0.52 29.90 27.67 −7.46 样品31 31.81 31.65 31.96 31.66 31.54 0.52 31.72 29.28 −7.69 对国家标准物质GBW07401a、GBW07405a、GBW07377、GBW07379也同时采用XRF法测定(三次测定,给出平均值)进行测试比对。由表9测试结果可知,本文方法与XRF测试结果有部分偏差,相对误差在−0.65%~4.80%。根据行业标准《土壤和沉积物 无机元素的测定 波长色散X射线荧光光谱法》(HJ 780—2015)可知,国家有证标准物质中元素含量在5%以上时,误差要求在5%以内,除了GBW07405a在认定值范围内,其余三个标准物质均在XRF测量误差范围以内。
表 9 标准物质测试结果比对Table 9. Comparison of analytical results of SiO2 content in national standard substances标准物质编号 本文方法Si含量
测定平均值(%)RSD
(%)XRF法Si含量
测定值(%)以SiO2计XRF法
测定值(%)SiO2含量认定值
及不确定度(%)以SiO2计本文方法与
XRF法相对误差(%)GBW07401a 26.52 0.40 27.69 59.24 56.60±0.46 4.66 GBW07405a 28.68 0.31 28.57 61.12 61.52±0.39 −0.65 GBW07377 29.65 0.26 31.10 66.53 63.48±0.43 4.80 GBW07379 32.62 0.54 33.17 70.96 69.66±0.6 1.87 3. 结论
建立了超声快速消解ICP-OES法快速测定土壤和沉积物中硅元素含量的分析方法。通过优化样品前处理条件,对密闭条件、超声时间、超声温度及双氧水加入量进行筛选,选择合适的分析谱线,测定了土壤和沉积物国家标准物质GBW07401a、GBW07405a、GBW07377、GBW07379中的硅含量,并进行了精密度及准确度实验,其相对标准偏差(RSD)在 0.26%~0.54%,相对误差在−0.28%~0.25%。并通过实际样品测试,验证了本文方法的适用范围。
与XRF法测试结果对比,本文方法操作简便、成本低,适用于大批量样品中易挥发元素硅的测定,对于其他易挥发元素的测定需要进一步探索。
-
![]()
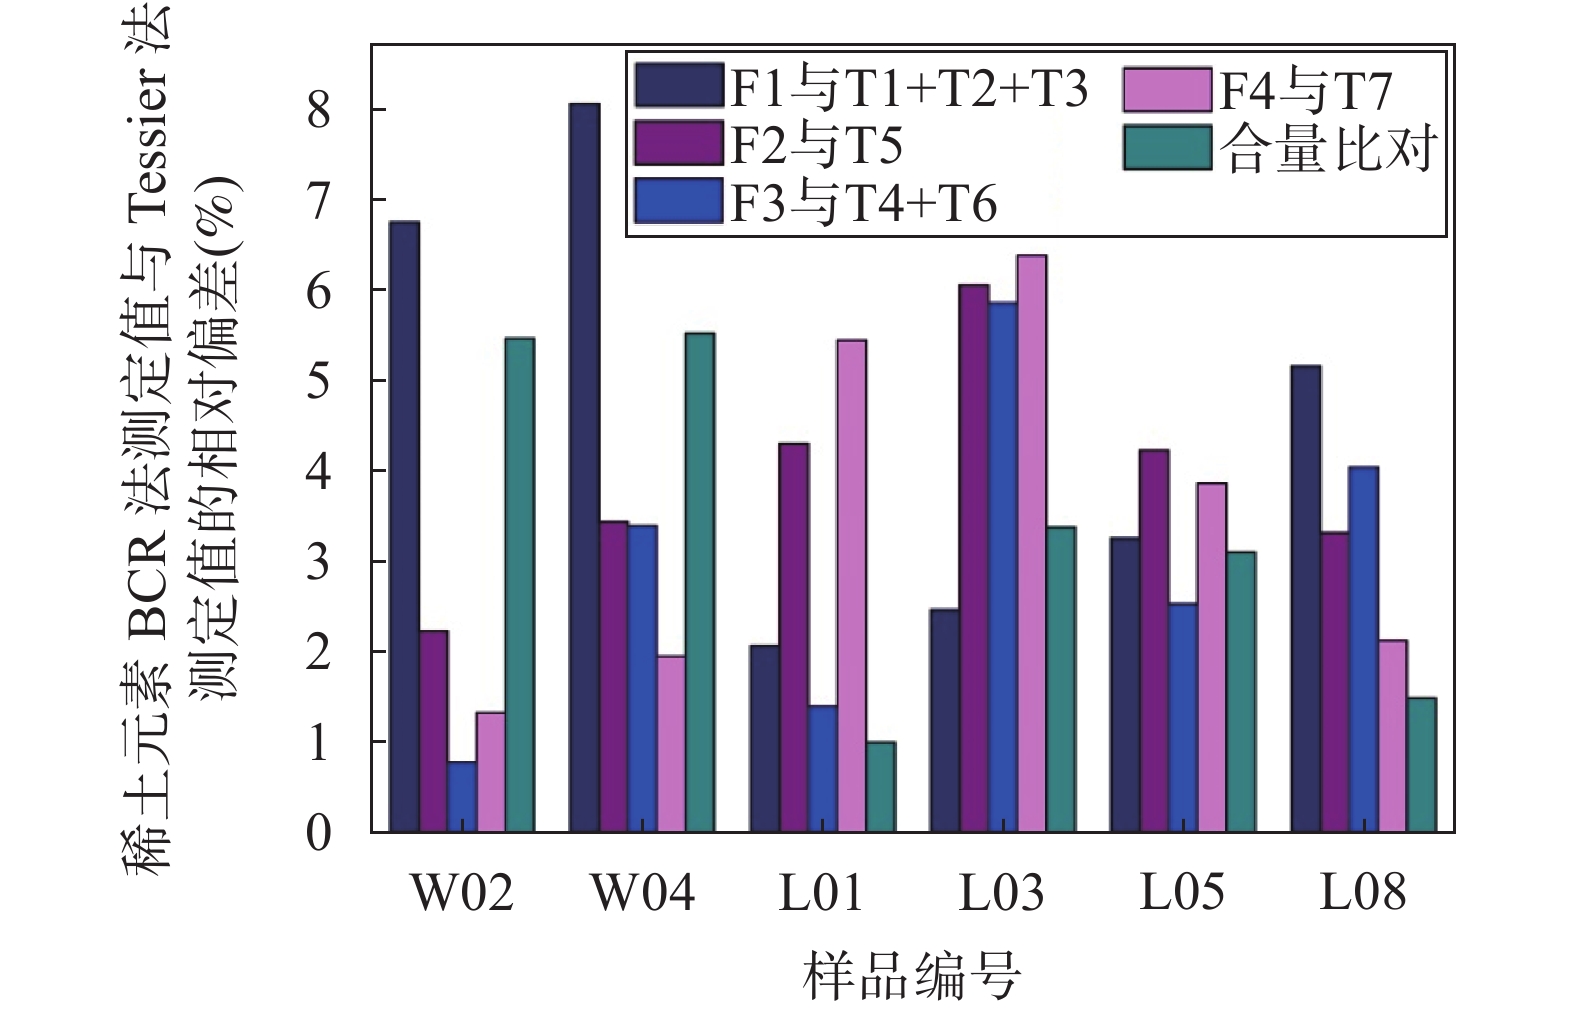
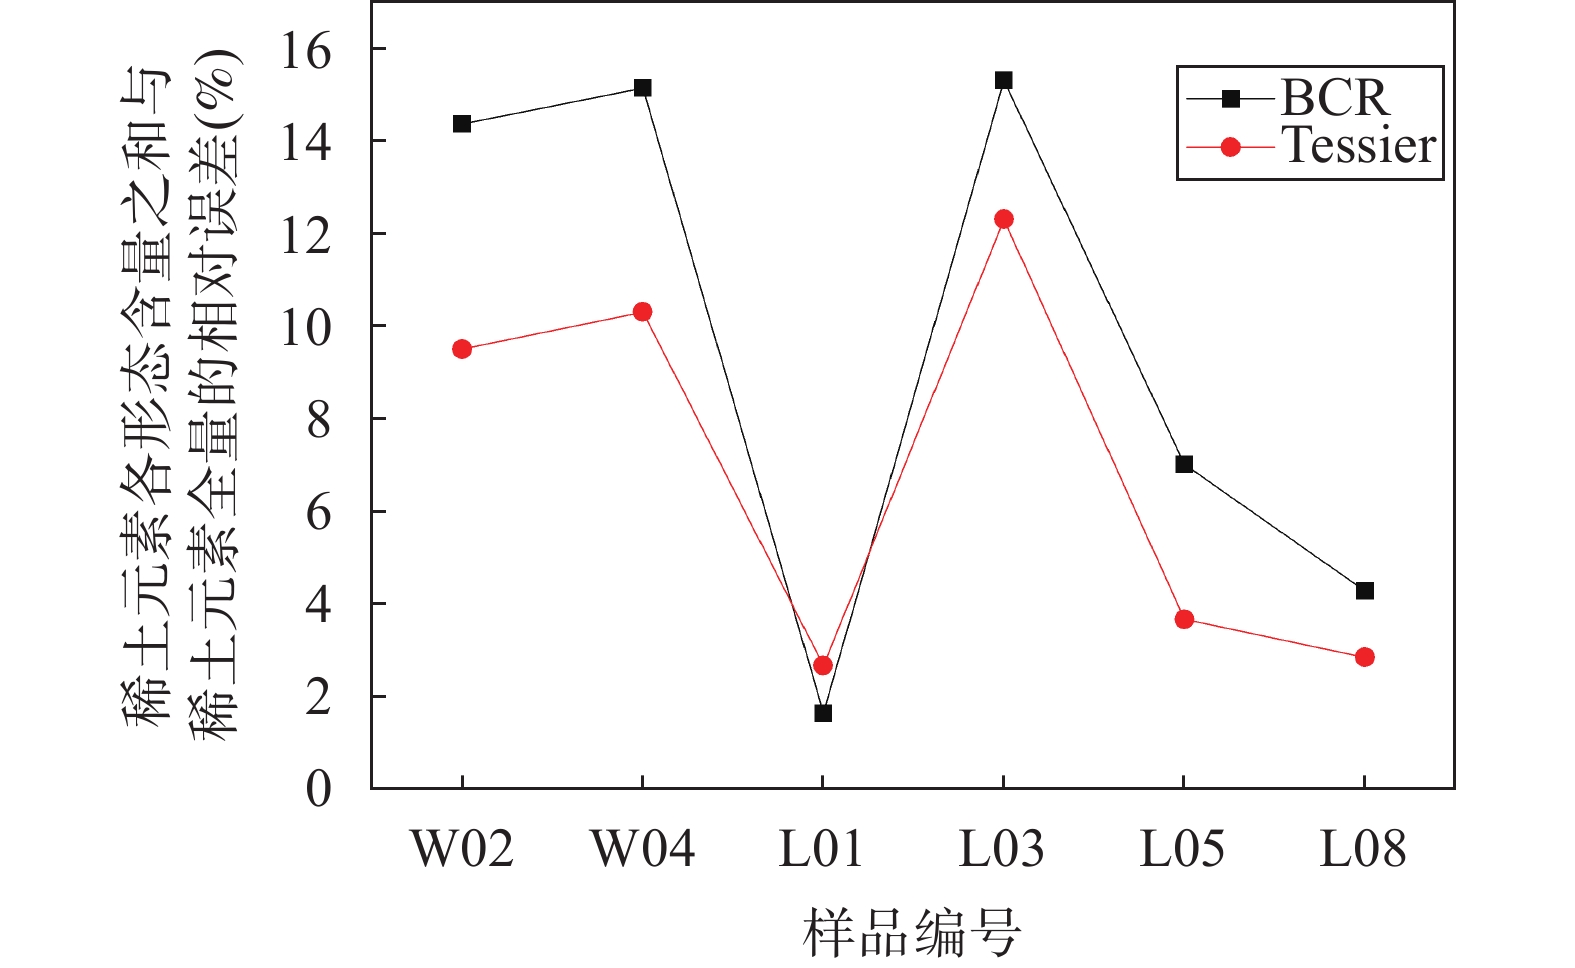
图 1 BCR法和Tessier法的方法准确度比对
Figure 1. Comparison of accuracy of BCR method and Tessier method
![]()
图 2 BCR法和Tessier法提取稀土元素形态结果比对
Figure 2. Comparison of REE extraction results between BCR method and Tessier method
![]()
图 3 Tessier法提取稀土元素各形态含量分布
Figure 3. The content distribution of various REE forms extracted by Tessier method
![]()
图 5 不同类型样品L01(a)和L08(b)中稀土元素各形态含量占比
Figure 5. The content proportion of various REE forms in different types of samples
表 1 电感耦合等离子体质谱仪工作条件
Table 1 Operating parameters for ICP-MS measurements
工作参数 设定值 工作参数 设定值 射频功率 1300W 扫描次数 40次 冷却气(Ar)流速 13.0L/min 采集方式 跳峰,3点/质量 辅助气(Ar)流速 1.0L/min 停留时间 10ms/点 雾化器气体(Ar)流速 0.85L/min 测量时间 30s 采样锥(镍)孔径 1.0mm 分析室真空度 ≤5.5×10⁻⁷mbar 截取锥(镍)孔径 0.7mm 主循环次数 3次  下载: 导出CSV
表 2 样品野外采集信息
Table 2 Field sampling information of the samples
样品编号 矿区 矿体 样品类型 岩性 采样深度(m) W02 A区 S1 全风化 中粒黑云母二长花岗岩 8~10 W04 B区 S15 全风化 粗中粒二云二长花岗岩 6~8 L01 D区 S3 全风化 中粒二长花岗岩 10~12 L03 D区 S1 全风化 中粒花岗岩 3.8~5.8 L05 D区 S3 母岩 中粗粒黑云母二长花岗岩 地表 L08 D区 S1 母岩 中细粒黑云母二长花岗岩 地表
下载: 导出CSV
表 3 方法精密度、检出限和准确度
Table 3 Precision, detection limit and accuracy tests of the method
稀土元素 GBW07160 GBW07161 GBW07185 空白
(μg/g)检出限
(μg/g)w0
(μg/g)w
(μg/g)RSD
(%)RE
(%)w0
(μg/g)w
(μg/g)RSD
(%)RE
(%)w0
(μg/g)w
(μg/g)RSD
(%)RE
(%)La 93.8±8.5 92.9 1.81 −0.99 2362±145 2372 1.59 0.43 6.52±0.17 6.45 3.57 −1.12 0.24 0.022 Ce 28.3±4.1 27.9 3.17 −1.37 187±8 186 2.34 −0.70 13.4±0.7 13.1 3.07 −2.62 0.31 0.025 Pr (37.2) 36.7 3.58 −1.29 447±25 444 1.75 −0.77 1.58±0.14 1.51 4.59 −4.48 0.033 0.008 Nd 189±17 191 2.26 1.19 1595±86 1586 1.56 −0.55 6.72±0.40 6.79 2.69 1.02 0.12 0.023 Sm 129±17 132 1.66 2.26 285±26 288 1.43 1.18 2.14±0.22 2.18 3.86 1.93 0.017 0.008 Eu 1.55±0.26 1.48 5.04 −4.52 64.8±3.6 66.4 1.76 2.39 0.11±0.03 0.11 5.19 −4.70 0.003 0.003 Gd (234) 236 1.71 0.96 226±26 228 2.05 1.04 3.01±0.26 3.07 3.58 1.97 0.016 0.008 Tb 49.1±5.1 47.8 3.29 −2.56 34.6±2.2 33.7 2.89 −2.63 0.61±0.07 0.62 2.84 1.94 0.003 0.003 Dy 314±44 317 1.16 0.96 183±17 186 1.68 1.76 4.11±0.13 3.98 1.95 −3.22 0.013 0.005 Ho 65.5±5.4 63.9 2.07 −2.42 35.7±4.0 34.7 2.58 −2.83 0.77±0.07 0.75 3.12 −2.11 0.003 0.004 Er 192±26 194 1.37 1.27 96.0±8.7 97.9 1.85 1.93 2.32±0.20 2.38 3.07 2.70 0.006 0.004 Tm 27.7±3.1 27.5 3.47 −0.90 13.2±1.1 12.7 3.04 −3.48 0.33±0.03 0.35 4.89 5.79 0.001 0.002 Yb 193±26 195 0.82 1.26 87.8±10.5 89.0 2.24 1.31 2.08±0.24 2.15 4.19 3.30 0.007 0.006 Lu 26.7±2.6 27.1 3.55 1.42 12.0±0.9 12.3 2.88 2.75 0.33±0.03 0.35 5.04 6.65 0.001 0.002 Y 2386±205 2398 1.69 0.49 976±47 984 1.69 0.86 23.6±0.6 23.7 2.57 0.62 0.077 0.027 注:括号内的数据为参考值。
下载: 导出CSV
表 4 稀土元素全量测定结果
Table 4 Determination results of REEs
稀土元素 W02
(μg/g)RD
(%)W04
(μg/g)RD
(%)L01
(μg/g)RD
(%)L03
(μg/g)RD
(%)L05
(μg/g)RD
(%)L08
(μg/g)RD
(%)La 584 1.07 477 1.40 455 1.60 260 1.26 71.2 1.43 92.1 1.63 Ce 222 2.66 123 3.71 237 1.95 118 3.63 94.3 1.38 179 1.06 Pr 98.4 2.34 96.2 2.08 75.9 4.72 55.4 2.56 16.4 1.83 18.9 3.70 Nd 326 2.82 354 2.75 253 1.35 171 2.98 55.7 1.26 64.5 1.30 Sm 56.4 1.56 91.0 1.87 52.6 4.71 21.5 6.98 9.34 3.00 10.6 2.26 Eu 6.05 4.30 7.41 2.16 5.66 6.71 2.05 5.85 1.22 3.28 1.27 3.15 Gd 35.4 0.34 58.2 0.45 59.1 2.81 11.4 4.39 7.07 1.41 8.59 2.10 Tb 4.30 3.72 8.76 1.14 12.9 6.51 1.08 11.11 1.05 7.62 1.21 6.61 Dy 19.7 1.22 45.3 2.69 80.6 2.70 3.46 4.62 5.64 1.77 6.17 1.62 Ho 3.38 2.37 7.74 1.29 15.6 4.76 0.63 6.35 1.06 3.77 1.11 5.41 Er 9.98 3.81 22.4 5.54 40.7 4.86 2.04 7.84 3.00 7.33 2.92 2.74 Tm 1.39 4.32 3.56 7.30 5.91 3.38 0.27 14.81 0.46 13.04 0.41 9.76 Yb 10.1 2.97 28.2 1.35 37.6 3.30 1.74 2.30 3.15 3.81 2.64 2.27 Lu 1.22 8.20 3.39 5.90 4.59 6.54 0.24 8.33 0.39 10.26 0.32 12.50 Y 83.1 0.91 245 0.85 608 1.43 17.2 5.58 28.7 0.84 29.5 1.02 ∑REEs 1462 0.79 1571 0.22 1944 0.63 666 0.64 299 0.20 420 1.25 ∑LREEs 1293 0.91 1149 0.12 1079 2.02 628 0.53 248 0.08 367 1.40 ∑HREEs 169 0.14 422 1.14 865 1.10 38.0 2.52 50.6 1.58 52.9 0.19 ∑LREEs/∑HREEs 7.67 2.72 1.25 16.50 4.91 6.93
下载: 导出CSV
表 5 BCR法稀土元素分步提取结果(n=2)
Table 5 Determination results of REE sequential extraction for BCR method
样品
编号形态
代号La
(μg/g)Ce
(μg/g)Pr
(μg/g)Nd
(μg/g)Sm
(μg/g)Eu
(μg/g)Gd
(μg/g)Tb
(μg/g)Dy
(μg/g)Ho
(μg/g)Er
(μg/g)Tm
(μg/g)Yb
(μg/g)Lu
(μg/g)Y
(μg/g)∑REEs
(μg/g)RD
(%)REEs
回收率
(%)W02 F1 510 24.5 75.0 249 41.7 4.01 27.0 3.14 14.0 2.39 7.52 0.90 7.14 0.79 66.2 1033 2.47 85.63 F2 1.17 10.0 0.31 1.35 0.26 0.02 0.25 0.03 0.17 0.02 0.04 0.01 0.07 0.01 0.25 14.0 3.14 F3 4.69 34.9 1.69 5.49 1.53 0.12 0.88 0.11 0.54 0.08 0.28 0.05 0.47 0.05 1.99 52.8 5.15 F4 8.69 125 1.78 6.59 1.48 0.57 1.52 0.16 0.85 0.14 0.52 0.07 0.61 0.08 3.25 151 2.83 合量 525 194 78.8 262 44.5 4.72 29.7 3.44 15.6 2.63 8.36 1.03 8.29 0.93 71.7 1251 1.95 W04 F1 382 10.2 67.6 251 63.9 5.44 40.8 5.17 24.2 4.03 11.7 1.49 12.3 1.47 101 982 2.03 84.88 F2 0.91 6.48 0.28 1.04 0.29 0.04 0.25 0.03 0.24 0.03 0.08 0.02 0.21 0.02 0.34 10.3 6.21 F3 3.66 19.0 1.52 5.44 1.91 0.21 1.04 0.14 0.90 0.17 0.38 0.07 0.71 0.08 2.42 37.7 4.56 F4 30.9 87.0 7.69 27.2 6.77 0.35 6.44 1.68 11.96 2.38 7.69 1.36 10.9 1.22 99.3 303 3.47 合量 417 123 77.1 285 72.9 6.04 48.5 7.02 37.3 6.61 19.9 2.94 24.1 2.79 203 1333 0.62 L01 F1 410 5.92 63.3 213 43.6 4.19 47.0 11.0 64.1 11.7 34.6 5.08 29.5 3.69 645 1591 1.72 101.64 F2 8.15 5.96 2.35 7.51 1.95 0.22 1.95 0.49 3.19 0.67 1.85 0.29 2.11 0.25 13.1 50.0 1.24 F3 16.0 12.1 4.38 14.1 3.14 0.31 3.29 0.89 5.21 1.24 3.14 0.44 3.35 0.41 30.1 98.0 2.82 F4 3.66 214 0.96 3.11 0.76 0.31 1.85 0.28 1.49 0.29 1.05 0.19 1.51 0.22 6.98 237 3.00 合量 438 238 71.0 238 49.5 5.03 54.1 12.7 74.0 13.9 40.6 6.00 36.5 4.57 695 1976 1.64 L03 F1 201 20.1 43.7 124 14.6 1.38 7.51 0.72 1.89 0.34 1.22 0.11 0.89 0.11 9.88 427 1.98 84.75 F2 5.48 4.31 1.44 5.48 0.91 0.07 0.69 0.14 0.78 0.15 0.39 0.05 0.39 0.05 3.33 23.7 4.05 F3 9.77 10.1 2.77 10.2 1.49 0.12 0.89 0.13 0.63 0.10 0.34 0.05 0.41 0.05 3.35 40.4 5.69 F4 5.44 60.4 1.00 3.21 0.46 0.07 0.66 0.05 0.24 0.05 0.09 0.02 0.10 0.02 0.91 72.7 4.24 合量 222 94.9 48.9 142.9 17.5 1.64 9.75 1.04 3.54 0.64 2.04 0.23 1.79 0.23 17.5 564 0.71 L05 F1 23.1 5.55 6.35 22.2 3.28 0.34 2.34 0.34 1.47 0.24 0.68 0.07 0.55 0.05 7.56 74.1 3.81 107.13 F2 14.1 10.1 3.44 12.0 2.24 0.24 1.54 0.37 1.24 0.26 0.65 0.07 0.66 0.08 6.44 53.4 2.77 F3 8.00 8.44 2.24 7.34 1.21 0.11 0.79 0.12 0.62 0.13 0.24 0.04 0.31 0.03 3.44 33.1 7.98 F4 28.1 75.7 6.44 21.2 3.69 0.66 3.04 0.49 2.85 0.58 1.55 0.29 1.77 0.19 12.9 159 4.16 合量 73.3 99.8 18.5 62.7 10.4 1.35 7.71 1.32 6.18 1.21 3.12 0.47 3.29 0.35 30.3 320 3.32 L08 F1 8.44 12.3 2.11 5.57 0.55 0.04 0.44 0.05 0.29 0.04 0.09 0.01 0.08 0.01 1.38 31.4 6.94 104.51 F2 6.44 12.4 1.49 7.14 1.59 0.09 1.35 0.25 1.34 0.19 0.55 0.08 0.49 0.06 7.04 40.5 4.74 F3 5.49 8.44 1.17 3.74 0.59 0.04 0.41 0.05 0.32 0.05 0.14 0.02 0.16 0.02 2.08 22.7 6.61 F4 71.4 158.3 14.2 49.7 7.88 1.19 6.25 0.95 4.69 0.88 2.38 0.35 2.24 0.29 23.2 344 1.92 合量 91.8 191 19.0 66.2 10.6 1.36 8.45 1.30 6.64 1.16 3.16 0.46 2.97 0.38 33.7 439 1.79 注:回收率为各形态分析步骤合量与稀土元素全量之比百分数。
下载: 导出CSV
表 6 Tessier法稀土元素分步提取结果(n=2)
Table 6 Determination results of REE sequential extraction for Tessier method
样品
编号形态
代号La
(μg/g)Ce
(μg/g)Pr
(μg/g)Nd
(μg/g)Sm
(μg/g)Eu
(μg/g)Gd
(μg/g)Tb
(μg/g)Dy
(μg/g)Ho
(μg/g)Er
(μg/g)Tm
(μg/g)Yb
(μg/g)Lu
(μg/g)Y
(μg/g)∑REEs
(μg/g)RD
(%)∑REEs
回收率
(%)W02 T1 16.9 0.23 2.95 10.4 2.37 0.22 1.70 0.23 1.09 0.18 0.50 0.07 0.42 0.05 5.18 42.5 4.28 90.45 T2 467 17.3 52.6 163 18.9 1.74 15.4 1.39 4.72 0.85 2.56 0.23 1.27 0.15 34.6 782 1.21 T3 55.1 8.92 24.6 92.0 25.2 2.60 13.5 2.00 10.0 1.69 5.08 0.78 6.13 0.73 33.0 281 2.69 T4 3.19 4.80 1.15 3.95 1.04 0.10 0.58 0.08 0.45 0.08 0.24 0.04 0.36 0.04 1.45 17.6 3.18 T5 1.12 9.82 0.35 1.26 0.28 0.02 0.21 0.03 0.13 0.02 0.07 0.01 0.09 0.01 0.27 13.7 3.21 T6 1.62 30.1 0.51 1.75 0.40 0.04 0.40 0.04 0.17 0.03 0.09 0.01 0.14 0.02 0.32 35.6 4.15 T7 8.54 123 1.91 6.44 1.44 0.47 1.55 0.19 0.96 0.16 0.47 0.08 0.68 0.09 3.06 149 2.89 合量 553 194 84.1 279 49.6 5.19 33.3 3.96 17.5 3.01 9.01 1.22 9.09 1.09 77.9 1321 1.94 W04 T1 25.6 0.76 4.00 13.5 2.50 0.24 1.88 0.24 1.14 0.20 0.54 0.07 0.44 0.05 5.73 56.9 3.23 89.70 T2 348 3.47 46.5 162 28.3 2.28 21.5 2.26 8.74 1.50 4.10 0.45 2.67 0.33 59.2 691 2.41 T3 42.6 7.87 23.3 94.6 37.6 3.33 19.9 3.31 16.8 2.57 7.45 1.29 10.9 1.29 43.8 317 1.71 T4 2.31 2.73 1.01 3.93 1.45 0.13 0.78 0.14 0.72 0.11 0.34 0.06 0.59 0.07 1.95 16.3 2.21 T5 0.87 6.63 0.30 1.18 0.38 0.04 0.26 0.04 0.21 0.03 0.10 0.02 0.17 0.02 0.37 10.6 5.09 T6 1.21 15.4 0.37 1.39 0.40 0.04 0.32 0.04 0.21 0.03 0.10 0.02 0.17 0.02 0.41 20.1 4.18 T7 30.0 84.6 7.59 27.0 6.95 0.32 6.64 1.61 11.7 2.40 7.56 1.31 10.6 1.30 97.3 297 1.58 合量 451 121 83.1 304 77.6 6.38 51.3 7.64 39.5 6.84 20.2 3.22 25.5 3.08 209 1409 1.49 L01 T1 0.04 0.02 0.01 0.03 0.01 0.00 0.01 0.00 0.01 0.00 0.01 0.00 0.00 0.00 0.07 0.21 8.60 102.68 T2 334 3.19 36.2 113 16.1 1.58 21.76 3.82 21.6 4.55 11.0 1.21 5.55 0.71 314 888 0.80 T3 85.2 2.96 29.9 107 28.7 3.08 29.59 7.42 48.3 9.18 24.7 3.78 25.3 3.10 328 736 0.86 T4 11.9 1.85 3.36 11.41 2.81 0.30 2.72 0.70 4.64 0.89 2.44 0.40 2.88 0.35 27.2 73.9 2.03 T5 7.98 5.76 2.12 7.36 1.72 0.19 1.82 0.46 3.11 0.62 1.67 0.26 1.90 0.23 12.7 47.9 3.80 T6 3.38 9.28 0.88 3.09 0.70 0.07 0.72 0.16 1.05 0.20 0.55 0.09 0.66 0.08 4.63 25.5 2.81 T7 3.54 203 0.89 2.90 0.73 0.27 1.67 0.21 1.40 0.29 0.95 0.18 1.36 0.17 6.72 224 2.10 合量 446 226 73.4 245 50.8 5.49 58.3 12.8 80.1 15.7 41.3 5.92 37.7 4.64 693 1996 0.64 L03 T1 0.01 0.00 0.00 0.01 0.00 0.00 0.00 0.00 0.00 0.00 0.00 0.00 0.00 0.00 0.00 0.02 11.27 87.67 T2 168 14.0 28.6 56.4 4.88 0.41 3.39 0.28 0.67 0.12 0.41 0.03 0.14 0.02 4.06 281 3.37 T3 35.4 8.71 15.8 70.1 10.9 1.02 4.44 0.55 1.34 0.27 0.85 0.12 0.86 0.11 6.16 157 2.94 T4 5.72 1.80 1.87 6.47 0.99 0.09 0.42 0.05 0.24 0.04 0.13 0.02 0.13 0.01 1.04 19.0 5.89 T5 5.79 4.54 1.65 5.78 0.96 0.10 0.75 0.15 0.85 0.16 0.43 0.06 0.45 0.05 3.43 25.2 4.22 T6 4.21 9.49 1.10 3.88 0.63 0.06 0.53 0.09 0.52 0.09 0.28 0.04 0.29 0.04 2.54 23.8 2.77 T7 5.73 64.3 1.04 3.40 0.60 0.09 0.73 0.07 0.28 0.05 0.13 0.02 0.15 0.02 0.95 77.6 3.92 合量 225 103 50.1 146 19.0 1.77 10.3 1.19 3.90 0.73 2.23 0.29 2.02 0.25 18.2 584 3.42 L05 T1 0.00 0.00 0.00 0.00 0.00 0.00 0.00 0.00 0.00 0.00 0.00 0.00 0.00 0.00 0.00 0.00 21.00 103.85 T2 5.32 0.38 0.81 2.55 0.28 0.02 0.24 0.02 0.09 0.01 0.04 0.00 0.01 0.00 0.64 10.4 4.04 T3 17.7 5.21 5.31 18.4 2.98 0.28 1.92 0.26 1.20 0.21 0.56 0.07 0.48 0.06 6.71 61.4 3.13 T4 5.23 2.30 1.34 4.65 0.77 0.07 0.47 0.07 0.35 0.06 0.16 0.02 0.15 0.02 1.97 17.6 2.84 T5 13.3 9.67 3.35 11.5 2.13 0.22 1.58 0.26 1.30 0.23 0.59 0.09 0.59 0.07 6.32 51.2 3.59 T6 2.88 6.27 0.79 2.83 0.53 0.05 0.39 0.06 0.34 0.06 0.17 0.03 0.19 0.02 1.66 16.3 3.19 T7 26.9 73.1 6.23 20.3 3.52 0.62 2.88 0.45 2.62 0.52 1.48 0.24 1.69 0.21 12.7 153 3.29 合量 71.3 96.9 17.8 60.2 10.2 1.26 7.48 1.12 5.90 1.09 3.00 0.45 3.11 0.38 30.0 310 1.79 L08 T1 0.00 0.00 0.00 0.00 0.00 0.00 0.00 0.00 0.00 0.00 0.00 0.00 0.00 0.00 0.00 0.00 14.10 102.96 T2 1.23 0.09 0.21 0.72 0.06 0.01 0.07 0.01 0.03 0.00 0.01 0.00 0.00 0.00 0.21 2.65 8.30 T3 7.06 11.2 1.50 4.72 0.56 0.04 0.45 0.05 0.22 0.04 0.10 0.01 0.09 0.01 1.11 27.2 3.99 T4 1.07 1.63 0.24 0.69 0.09 0.01 0.07 0.01 0.04 0.01 0.03 0.00 0.02 0.00 0.22 4.13 7.28 T5 6.52 12.8 1.84 7.37 1.74 0.10 1.39 0.23 1.29 0.23 0.59 0.08 0.54 0.07 7.15 41.9 2.96 T6 4.49 7.06 0.98 3.30 0.55 0.04 0.40 0.06 0.31 0.05 0.14 0.02 0.13 0.02 1.99 19.5 3.59 T7 69.7 157 13.9 47.5 7.74 1.14 6.09 0.89 4.52 0.82 2.20 0.31 2.03 0.23 22.7 337 2.03 合量 90.1 190 18.7 64.3 10.7 1.34 8.47 1.25 6.41 1.15 3.07 0.42 2.81 0.33 33.4 432 2.40 注:回收率为各形态分析步骤合量与稀土元素全量之比百分数。
下载: 导出CSV
-
[1] 王倩. 土壤稀土形态分析方法与地球化学应用研究[D]. 北京: 中国地质大学(北京), 2014. Wang Q. Study on the speciation of REE in soil and its application in geochemistry[D]. Beijing: China University of Geosciences (Beijing), 2014.
[2] 黄健. 广东仁居风化壳离子吸附型稀土矿床中稀土元素的富集分异机制研究[D]. 北京: 中国科学院大学, 2021. Huang J. REE enrichment and fractionation mechanism of the Renju ion adsorption type REE deposit in Guangdong Province [D]. Beijing: University of Chinese Academy of Sciences, 2021.
[3] 林卓玲, 黄光庆. 土壤稀土元素的迁移-富集机制及其生态效应[J]. 地球环境学报, 2023, 14(5): 521−538. doi: 10.7515/JEE221024 Lin Z L, Huang G Q. Migration enrichment mechanism and ecological effects of rare elements in soil[J]. Journal of Earth Environment, 2023, 14(5): 521−538. doi: 10.7515/JEE221024
[4] 宋旭东, 樊小伟, 陈文, 等. 电感耦合等离子体质谱法测定离子吸附型稀土矿中全相稀土总量[J]. 冶金分析, 2018, 38(6): 19−24. doi: 10.13228/j.boyuan.issn1000-7571.010305 Song X D, Fan X W, Chen W, et al. Determination of total-phase rare earth content in ion-adsorption rare earth ore by inductively coupled plasma mass spectrometry[J]. Metallurgical Analysis, 2018, 38(6): 19−24. doi: 10.13228/j.boyuan.issn1000-7571.010305
[5] 朱云, 郭琳, 于汀汀, 等. 提取风化壳淋积型稀土矿中稀土元素的前处理方法探讨[J]. 岩矿测试, 2023, 42(5): 877−887. doi: 10.15898/j.ykcs.202308070130 Zhu Y, Guo L, Yu T T, et al. Discussion on pretreatment method for extracting rare earth elements from weathered crust elution-deposited rare earth ores[J]. Rock and Mineral Analysis, 2023, 42(5): 877−887. doi: 10.15898/j.ykcs.202308070130
[6] 王臻, 肖仪武, 冯凯. 离子吸附型稀土矿成矿特点及元素赋存形式[J]. 有色金属(选矿部分), 2021(6): 43−51. doi: 10.3969/j.issn.1671-9492.2021.06.006 Wang Z, Xiao Y W, Feng K. Metallogenic characteristics and occurrence of REE in ion adsorption type rare earth deposits[J]. Nonferrous Metals (Mineral Processing Section), 2021(6): 43−51. doi: 10.3969/j.issn.1671-9492.2021.06.006
[7] Tessier A, Campbell P G C, Bisson M. Sequential extraction procedure for the speciation of particulate trace metals[J]. Analytical Chemistry, 1979, 51(7): 844−851. doi: 10.1021/ac50043a017
[8] Quevauviller P, Rauret G, Griepink B. Single and sequential extraction in sediments and soils[J]. International Journal of Environmental Analytical Chemistry, 1993, 51(1/2/3/4): 231−235. doi: 10.1080/03067319308027629
[9] Shuman L. Fractionation method for soil microelements[J]. Soil Science, 1985, 140(1): 11−22. doi: 10.1097/00010694-198507000-00003
[10] Gibson M J, Farmer J G. Multi-step sequential chemical extraction of heavy metals from urban soils[J]. Environmental Pollution, 1986, 11(2): 117−135. doi: 10.1016/0143-148x(86)90039-x
[11] Miller W P, Martens D C, Zelazny L W. Effect of sequence in extraction of trace metals from soils[J]. Soil Science of America Journal, 1986, 50(3): 598−601. doi: 10.2136/sssaj1986.03615995005000030011x
[12] 李娜, 夏瑜, 何绪文, 等. 基于Tessier法的土壤中不同形态镉的转化及其影响因素研究进展[J]. 土壤通报, 2021, 52(6): 1505−1512. doi: 10.19336/j.cnki.trtb.2020111101 Li N, Xia Y, He X W, et al. Research progress of Cd form transformation and the effective environmental factors in soil based on Tessier analysis[J]. Chinese Journal of Soil Science, 2021, 52(6): 1505−1512. doi: 10.19336/j.cnki.trtb.2020111101
[13] 杨华, 王艳丽, 李利荣. 涡旋提取-改进BCR法测定土壤中重金属的化学形态[J]. 中国无机分析化学, 2023, 13(6): 598−603. doi: 10.3969/j.issn.2095-1035.2023.06.013 Yang H, Wang Y L, Li L R. Determination of chemical morphology of heavy metals in soil by vortex extraction and improved BCR method[J]. Chinese Journal of Inorganic Analytical Chemistry, 2023, 13(6): 598−603. doi: 10.3969/j.issn.2095-1035.2023.06.013
[14] 余璨. BCR多级连续提取法在拉萨河流域表层沉积物重金属形态分析研究中的应用[D]. 拉萨: 西藏大学, 2019. Yu C. Application of BCR sequential extraction procedure on heavy metal speciation in surface sediments of the Lhasa River Catchments[D]. Lhasa: Tibet University, 2019.
[15] 陈莉薇, 陈海英, 武君, 等. 利用Tessier五步法和改进BCR法分析铜尾矿中Cu、Pb、Zn赋存形态的对比研究[J]. 安全与环境学报, 2020, 20(2): 735−740. doi: 10.13637/j.issn.1009-6094.2019.0661 Chen L W, Chen H Y, Wu J, et al. Comparative study on speciation of Cu, Pb and Zn from mining tailings via Tessier 5-step sequential extraction and improved BCR method[J]. Journal of Safety and Environment, 2020, 20(2): 735−740. doi: 10.13637/j.issn.1009-6094.2019.0661
[16] 李默挺, 陶红, 孙燕, 等. 改进的BCR连续提取法-电感耦合等离子体质谱法分析水泥基底泥固化材料中重金属形态[J]. 理化检验(化学分册), 2019, 55(4): 401−407. Li M T, Tao H, Sun Y, et al. ICP-MS determination of combination states of heavy metal elements in solidified materials of cement-based sediment with separation by modified BCR successive extraction[J]. Physical Testing and Chemical Analysis (Part B: Chemical Analysis), 2019, 55(4): 401−407.
[17] 张安丰, 杨博为, 王永鑫, 等. 动能歧视(KED)-电感耦合等离子体质谱(ICP-MS)法测定贵州沉积型稀土矿中16中稀土元素[J]. 中国无机分析化学, 2024, 14(5): 575−585. doi: 10.3969/j.issn.2095-1035.2024.05.009 Zhang A F, Yang B W, Wang Y X, et al. Determination of 16 rare elements in sedimentary rare earth ores in Guizhou Province by inductively coupled plasma mass spectrometry with kinetic energy discrimination (KED)[J]. Chinese Journal of inorganic Analytical Chemistry, 2024, 14(5): 575−585. doi: 10.3969/j.issn.2095-1035.2024.05.009
[18] 张民, 何显川, 谭伟, 等. 云南临沧花岗岩离子吸附型稀土矿床地球化学特征及其成因讨论[J]. 中国地质, 2022, 49(1): 201−214. doi: 10.12029/gc20220112 Zhang M, He X C, Tan W, et al. Geochemical characteristics and genesis of ion-adsorption type REE deposit in the Lincang granite, Yunnan[J]. Geology in China, 2022, 49(1): 201−214. doi: 10.12029/gc20220112
[19] 高国华, 颜鋆, 赖安邦, 等. 离子吸附型稀土矿抗坏血酸强化-还原浸取过程[J]. 中国有色金属学报, 2019, 29(6): 1289−1297. doi: 10.19476/j.ysxb.1004.0609.2019.06.18 Gao G H, Yan J, Lai A B, et al. Intensification-reduction leaching process of ion-adsorption type rare earths ore with ascorbic acid[J]. The Chinese Journal of Nonferrous Metals, 2019, 29(6): 1289−1297. doi: 10.19476/j.ysxb.1004.0609.2019.06.18
[20] 周华娇. 离子吸附型稀土浸取特征评价与浸取剂选择[D]. 南昌: 南昌大学, 2022. Zhou H J. Evaluation of ion-adsorption rare earths leaching characterization and the selection of leaching reagents[D]. Nanchang: Nanchang University, 2022.
[21] 王学峰, 许春雪, 顾雪, 等. 典型稀土矿区周边土壤中稀土元素含量及赋存形态研究[J]. 岩矿测试, 2019, 38(3): 137−146. doi: 10.15898/j.cnki.11-2131/td.201807180085 Wang X F, Xu C X, Gu X, et al. Concentration and fractionation of rare earth elements in soils surrounding rare earth ore area[J]. Rock and Mineral Analysis, 2019, 38(3): 137−146. doi: 10.15898/j.cnki.11-2131/td.201807180085
[22] 高晶晶, 刘季花, 李先国, 等. 富钴结壳中稀土元素化学相态分析方法及其应用[J]. 分析化学, 2015, 43(12): 1895−1900. doi: 10.11895/j.issn.0253-3820.150418 Gao J J, Liu J H, Li X G, et al. Chemical phase analysis of rare earth elements in cobalt-rich crusts and its application[J]. Chinese Journal of Analytical Chemistry, 2015, 43(12): 1895−1900. doi: 10.11895/j.issn.0253-3820.150418
[23] 王彪, 黄庆, 何良伦, 等. 黔西北麻乍地区沉积型稀土矿中稀土元素赋存状态研究[J]. 矿物学报, 2023, 43(12): 789−798. doi: 10.16461/j.cnki.1000-4734.2023.43.087 Wang B, Huang Q, He L L, et al. The occurrence state of rare earth elements in sedimentary rare earth deposits in Mazha area, Northwest Guizhou[J]. Acta Mineralogica Sinica, 2023, 43(12): 789−798. doi: 10.16461/j.cnki.1000-4734.2023.43.087
[24] 夏传波, 成学海, 姜云, 等. 密闭酸溶-电感耦合等离子体发射光谱/质谱法测定花岗伟晶岩中32种微量元素[J]. 岩矿测试, 2024, 43(2): 247−258. doi: 10.15898/j.ykcs.202307310105 Xia C B, Cheng X H, Jiang Y, et al. Determination of 32 trace elements in granite pegmatite by inductively coupled plasma-optical emission spectrometry and mass spectrometry with closed acid dissolution[J]. Rock and Mineral Analysis, 2024, 43(2): 247−258. doi: 10.15898/j.ykcs.202307310105
[25] 苏春风. 电感耦合等离子体质谱(ICP-MS)法测定稀土矿中16种稀土元素含量[J]. 中国无机分析化学, 2020, 10(6): 28−32. doi: 10.3969/j.issn.2095-1035.2020.06.007 Su C F. Determination of 16 rare earth elements in rare earth ores by inductively coupled plasma mass spectrometry[J]. Chinese Journal of Inorganic Analytical Chemistry, 2020, 10(6): 28−32. doi: 10.3969/j.issn.2095-1035.2020.06.007
[26] 黄健, 谭伟, 梁晓亮, 等. 富稀土矿物的风化特征及其对稀土成矿过程的影响——以广东仁居离子吸附型稀土矿床为例[J]. 地球化学, 2022, 51(6): 684−695. doi: 10.19700/j.0379-1726.2022.06.007 Huang J, Tan W, Liang X L, et al. Weathering characters of REE-bearing accessory minerals and their effects on REE mineralization in Renju Regolith-hosted REE deposits in Guangdong Province[J]. Geochimica, 2022, 51(6): 684−695. doi: 10.19700/j.0379-1726.2022.06.007
[27] 梁晓亮, 谭伟, 马灵涯, 等. 离子吸附型稀土矿床形成的矿物表/界面反应机制[J]. 地学前缘, 2022, 29(1): 29−41. doi: 10.13745/j.esf.sf.2021.8.8 Liang X L, Tan W, Ma L Y, et al. Mineral surface reaction constraints on the formation of ion-adsorption rare earth element deposits[J]. Earth Science Frontiers, 2022, 29(1): 29−41. doi: 10.13745/j.esf.sf.2021.8.8
[28] Li Y H M, Zhou M F, Williams-Jones A E. The genesis of regolith-hosted heavy rare earth element deposits: Insights from the world-class Zudong deposit in Jiangxi Province, South China[J]. Economic Geology, 2019, 114(3): 541−568. doi: 10.5382/econgeo.4642
[29] 张怡斐. 市政污泥热处理过程中主要污染物的迁移转化[D]. 上海: 上海交通大学, 2011. Zhang Y F. Migratory behavior of major contaminant in the thermal treatment process of sludge[D]. Shanghai: Shanghai Jiao Tong University, 2011.
[30] Han R S, Liu C Q, Emmanuel J M C, et al. REE geochemistry of altered tectonites in the Huize base-metal district, Yunnan, China[J]. Geochemistry: Exploration, Environment, Analysis, 2012, 12: 127−146. doi: 10.1144/1467-7873/10-mindep-053
[31] 罗武平, 李光来, 李成详, 等. 江西相山下家岭稀土矿风化壳剖面地球化学特征[J]. 矿物学报, 2019, 39(3): 237−246. doi: 10.16461/j.cnki.1000-4734.2019.39.057 Luo W P, Li G L, Li C X, et al. Geochemical characteristics of the weathered crust profile in the Xiajialing REE deposit of the Xiangshan area, Jiangxi Province, China[J]. Acta Mineralogica Sinica, 2019, 39(3): 237−246. doi: 10.16461/j.cnki.1000-4734.2019.39.057
[32] Williams-Jones A E, Vasyukova O V. The economic geology of scandium, the runt of the rare earth element litter[J]. Economic Geology, 2018, 113(4): 973−988. doi: 10.5382/econgeo.2018.4579
[33] 王长兵, 倪光清, 瞿亮, 等. 花岗岩风化壳中Ce地球化学特征及其找矿意义——以滇西岔河离子吸附型稀土矿床为例[J]. 矿床地质, 2021, 10(5): 1013−1028. doi: 10.16111/j.0258-7106.2021.05.008 Wang C B, Ni G Q, Qu L, et al. Ce geochemical characteristics of granite weathering crust and its prospecting significance: A case study of Chahe ion adsorption rare earth deposit in Western Yunnan[J]. Mineral Deposits, 2021, 10(5): 1013−1028. doi: 10.16111/j.0258-7106.2021.05.008


计量
- 文章访问数: 145
- HTML全文浏览量: 34
- PDF下载量: 36
 京公网安备 11010202008159号